Figure 1.
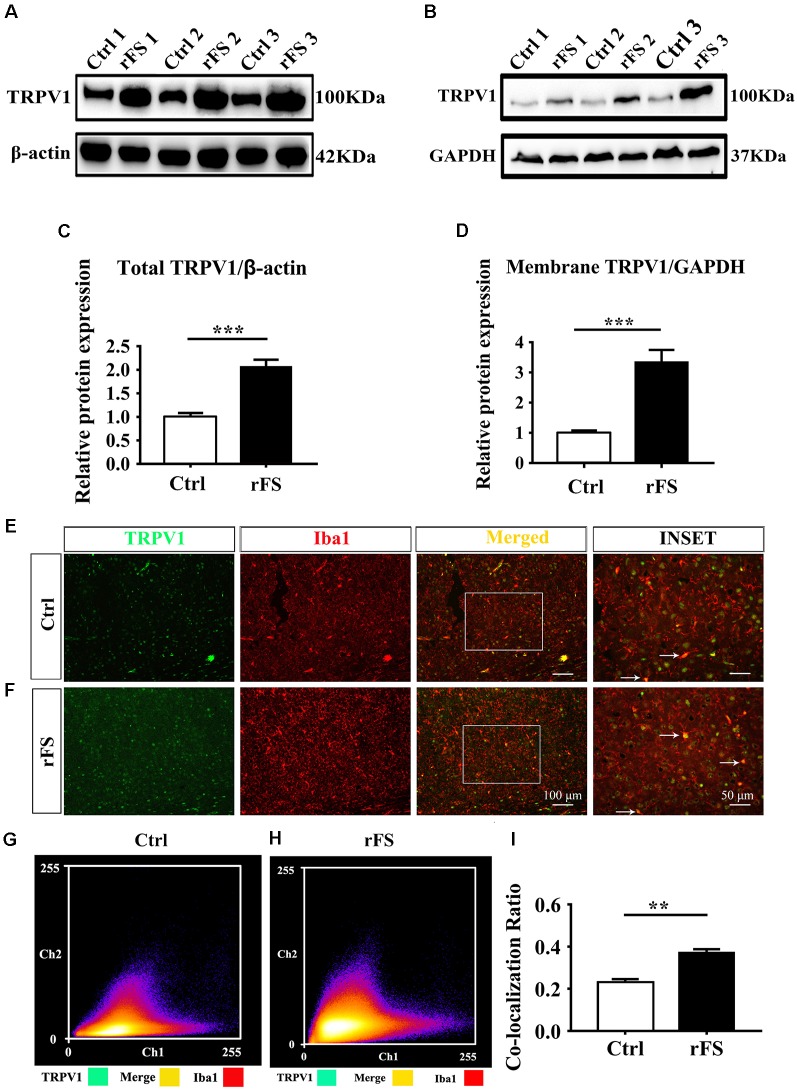
Transient receptor potential vanilloid type 1 (TRPV1) protein expression pattern in cortical microglia after rFS. (A,B) Western blot analysis of total protein (A) and membrane protein expression (B) of TRPV1 in three samples from rFSs group’s mice. (C,D) Representative of the quantification analysis of total (C) and membrane (D) TRPV1 expression were significantly increased in rFSs mice compared with controls (n = 6 per groups, ***p < 0.001, unpaired, two-tailed Student’s t-test compared with control). (E,F) Representative images of immunofluorescence double-labeling for TRPV1 (visualized in green FITC) and Iba1 (visualized in red Alexa Fluor 594) in the cortex after rFS. TRPV1 positive signals highly merged with the Iba1 in the rFS brain (Scale bars: 100 μm). (INSET) White arrow represents the merged panels in magnified images of the squared areas (Scale bars: 50 μm). (G,H) Cartogram representation (scatter plot) of the correlation coefficient of Pearson (PCC) for quantifying the co-expression between the TRPV1 and Iba1 in control mice (PCC = 0.22 ± 0.016) and in rFSs mice (PCC = 0.37 ± 0.018). (I) The histograms represent the ratio of the mean PCC calculated from the colocalizating in four samples. Data were presented as means ± standard error of the mean (SEM), n = 4 per groups, **p < 0.01, unpaired, two-tailed Student’s t-test compared with control.

