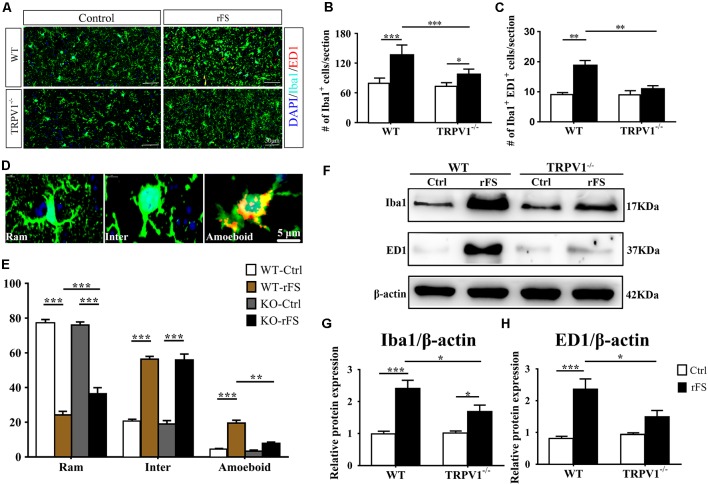
Figure 3.
The presence or absence of TRPV1 influences microglial pathophysiological changes in recurrent febrile seizures mice. (A) Images of the cortex immunostained for the microglial marker Iba-1 (visualized in green FITC) and the lysosomal marker CD68/ED1 (visualized in red Alexa Fluor 594) and DAPI (visualized in blue) 5 days after rFS from wild type (WT) and TRPV1−/− mice (Scale bars: 50 μm). (B,C) Bar graph of quantification of Iba1+ (B) and Iba1+ ED1+ (C) in 5 days after rFS mice cortex. (D) Representative photomicrographs of different microglial morphological subtypes including resting/ramified (Ram), hypertrophic/intermediate (Inter) and round/ameboid (Amoeboid; Scale bars: 5 μm). (E) Quantification of relative percentage of microglia with different morphologies in the cortex of WT and TRPV1−/− mice (n = 6 per groups, **p < 0.01, ***p < 0.001, two-way ANOVA followed by Tukey’s multiple comparisons). (F–H) Representative Immunoblot bands (F) and densitometric analysis of Iba1 expression (G) and ED1 expression (H) were significantly increased in rFS from WT mice than in TRPV1−/− mice. Data were presented as means ± SEM, n = 6 per groups, *p < 0.05, **p < 0.01, ***p < 0.001, two-way ANOVA followed by Tukey’s multiple comparisons.

