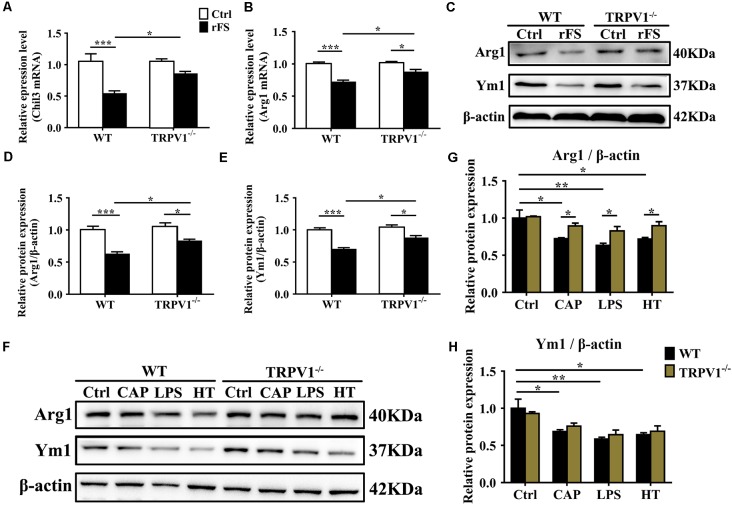
Figure 5.
TRPV1 suppresses the expression of Arg1 and Ym1 in activated microglia. (A,B) Quantitative PCR (qPCR) analysis of Chil3 (A) and Arg1 (B) mRNA expression in cortical tissues of WT (n = 6) and TRPV1−/−(n = 6) mice after rFS. Values were shown for steady-state transcripts relative to β-actin. Data were presented as mean ± SEM (n = 6 per groups, *p < 0.05, **p < 0.01, ***p < 0.001, two-way ANOVA followed by Tukey’s multiple comparisons). (C–E) Representative Immunoblot bands (C) and densitometric analysis of Arg1 expression (D) and Ym1 expression (E) were significantly decreased in rFS from WT mice than in TRPV1−/− mice (n = 6 per groups, *p < 0.05, ***p < 0.001, two-way ANOVA followed by Tukey’s multiple comparisons). (F–H) Representative Immunoblot bands (F) and densitometric analysis of Arg1 expression (G) and Ym1 expression (H) was significantly decreased in the cortex microglia of WT mice than in TRPV1−/− mice after treatment of Capsaicin (10 μM), Hyperthermia (43°C, 4*30 min) and LPS (1.0 μg/ml), respectively. Data were presented as means ± SEM, n = 6 per groups, *p < 0.05, **p < 0.01, two-way ANOVA followed by Tukey’s multiple comparisons.

