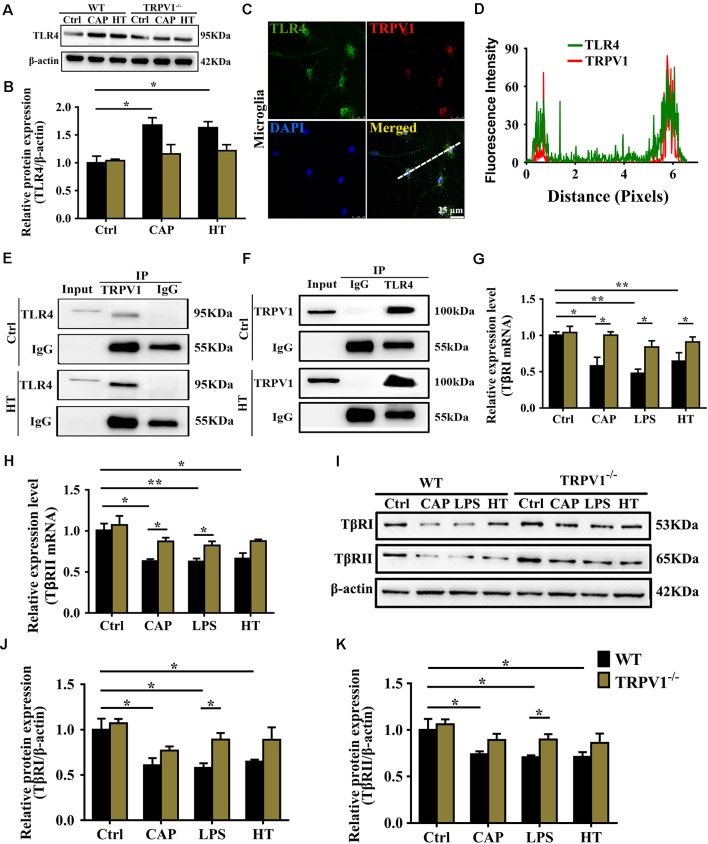
Figure 6.
TRPV1 and toll-like receptor 4 (TLR4) mutually inhibited the transforming growth factor-β1 (TGF-β1) signaling in activated microglia. (A) Representative western blot bands of TLR4 shows CAP (10 μM) or hyperthermia-induced microglia activation from WT and TRPV1−/− mice. (B) Graphic representation protein levels of TLR4 were standardized to β-actin. All data are mean ± SEM (n =3, *P < 0.05 vs. control, two-way ANOVA followed by Tukey’s multiple comparisons). (C) Photomicrograph immunocytochemistry indicated different co-expression of TRPV1 (visualized in red Cy3), TLR4 (visualized in green DyLight 488), and cell nuclei (visualized in dark blue DAPI) in activated microglia. Note the colocalization indicated by merge yellow fluorescence, the fluorescence intensity of TRPV1 and TLR4 along the indicated line were scanned by using ImageJ software, and their colocalization was determined by the PCC method (D). (Scale bars: 25 μm). (E,F) Co-IP showed that interaction between TRPV1 and TLR4 in microglia. Microglia lysates were immunoprecipitated with TRPV1 antibody and then immunoblotted with anti-TLR4 antibody as indicated, vice versa. (G,H) qPCR analysis of TβRI (G) and TβRII (H) mRNA expression in the cortex microglia of WT mice than in TRPV1−/− mice after treatment of Capsaicin (10 μM), Hyperthermia (43°C, 4*30 min) and LPS (1.0 μg/ml), respectively. Values were shown for steady-state transcripts relative to β-actin. Data were presented as mean ± SEM (n = 3 per groups, *p < 0.05, **p < 0.01, two-way ANOVA followed by Tukey’s multiple comparisons). (I–K) Representative Immunoblot bands (I) and densitometric analysis of TβRI expression (J) and TβRII expression (K) was significantly decreased in the cortex microglia of WT mice than in TRPV1−/− mice after treatment of Capsaicin (10 μM), Hyperthermia (43°C, 4*30 min) and LPS (1.0 μg/ml), respectively. Data were presented as means ± SEM, n = 3 per groups, *p < 0.05, two-way ANOVA followed by Tukey’s multiple comparisons.

