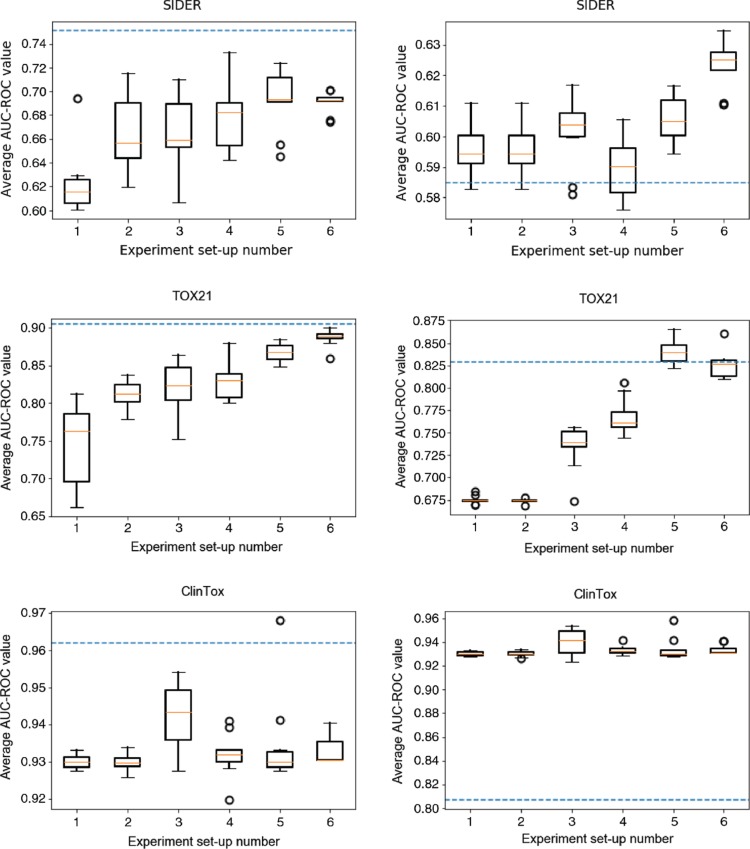
Figure 2:
The distribution of the achieved AUC-ROC values averaged over all target variables for each experimental set-up. The blue dashed line represents the result achieved by the GCNN presented by Wu et al. [21]. The left plot is the achieved results on the training data and the right plot is the achieved results on the test data.

