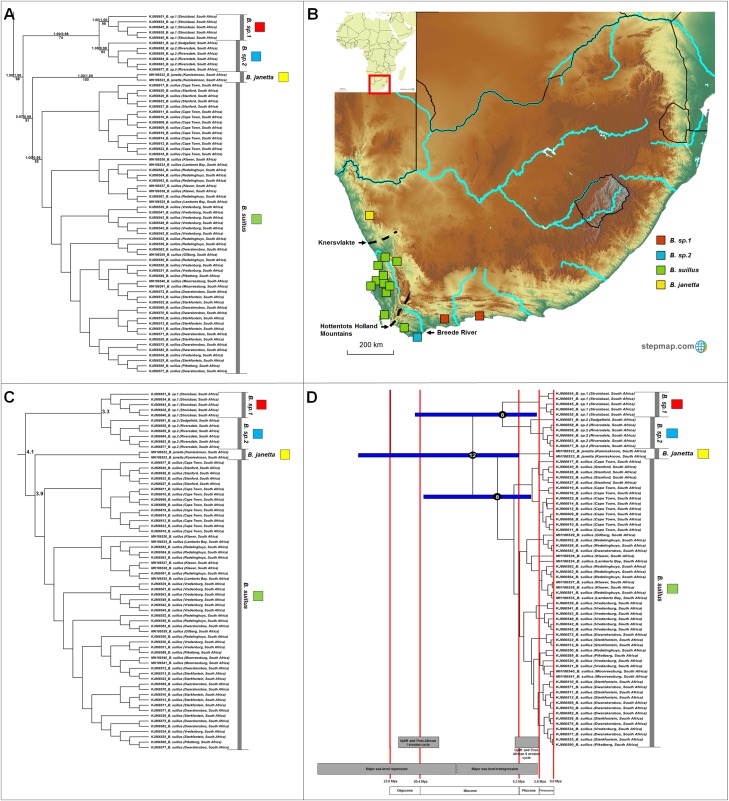
Figure 4. Phylogeny, geographic distributions, sequence divergences and divergence dates of species within the genus Bathyergus.
(A) Phylogeny of the genus Bathyergus based on the cytochrome b data and indicating the different species included and identified. Values above nodes represent posterior probability values derived from the Bayesian analysis in BEAST and MrBayes respectively, while values below nodes indicate bootstrap values derived after Maximum Likelihood analysis in RAxML. The geographic location (point locality for the specimen) of the recovered species is portrayed in (B) with the uncorrected sequence divergences (%) at the various nodes shown in (C). The divergence date estimates (in Mya) for each node is indicated within the black circles in (D), with the blue bars representing the temporal range of the divergence (derived from the dating analysis in BEAST). The red bars represent the temporal boundaries among the epochs, with the timing and temporal extent of major landscape changes which occurred across the distribution of the genus indicated at the bottom.

