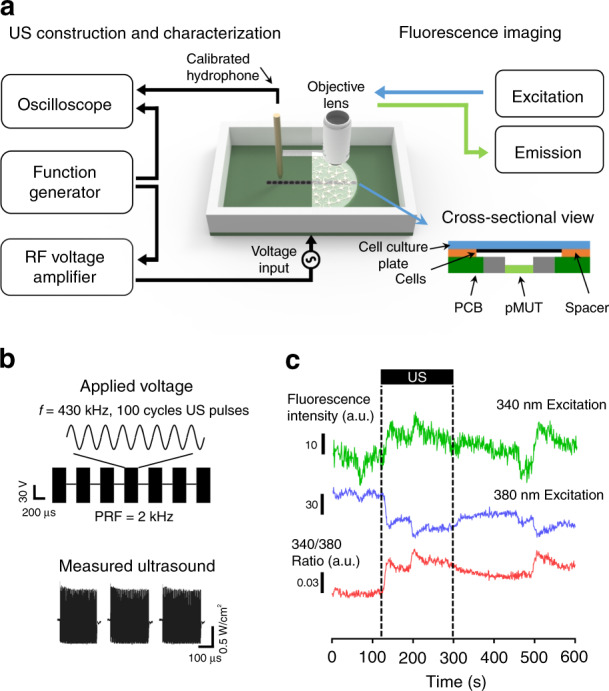
Fig. 4. Experimental setup for mechanical characterization and optical recording.

a schematic diagram of the characterization (left) and general configuration (right) of the system; b applied voltage signals of 100 cycles, 430-kHz sine wave pulses to the pMUT array and measured acoustic intensity by a calibrated hydrophone; c representative ultrasound-induced fluorescence trace of ratiometric dye Fura-2 AM showing fluorescence intensities that were increased by 340 nm of excitation light and decreased by 380 nm of excitation light
