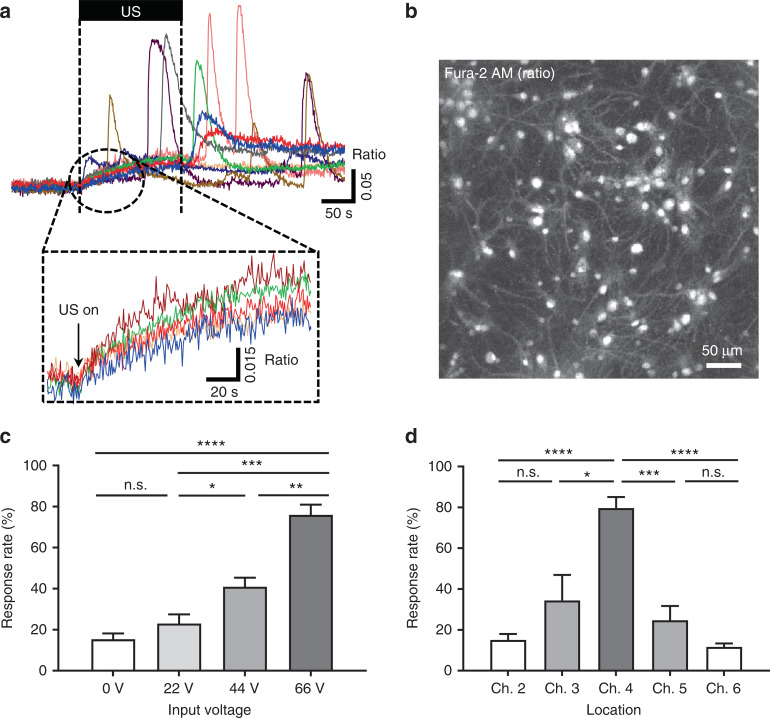
Fig. 7. Responses of cocultured cells stimulated by the ultrasound from the pMUT array through measurement of the real-time change in the intracellular Ca2+ concentration.
a plot of the transients in the intracellular concentration change of Ca2+ of responding cells by ultrasound at the input voltage of 66 V; magnified view of the plot shows the gradual change of calcium concentration by ultrasound; the different colors represent responses from different cells; b fluorescence image of the intracellular calcium-specific marker Fura-2 AM; c response rate of stimulated cells by ultrasound with different input voltages; d response rate of stimulated cells by ultrasound with different horizontal locations of the Ch. 4 transducer; data are presented as the mean ± SEM. values. Student’s t-test were used to analyze the differences. *p < 0.05, **p < 0.01, ***p < 0.001, ****p < 0.0001, n.s: not significant

