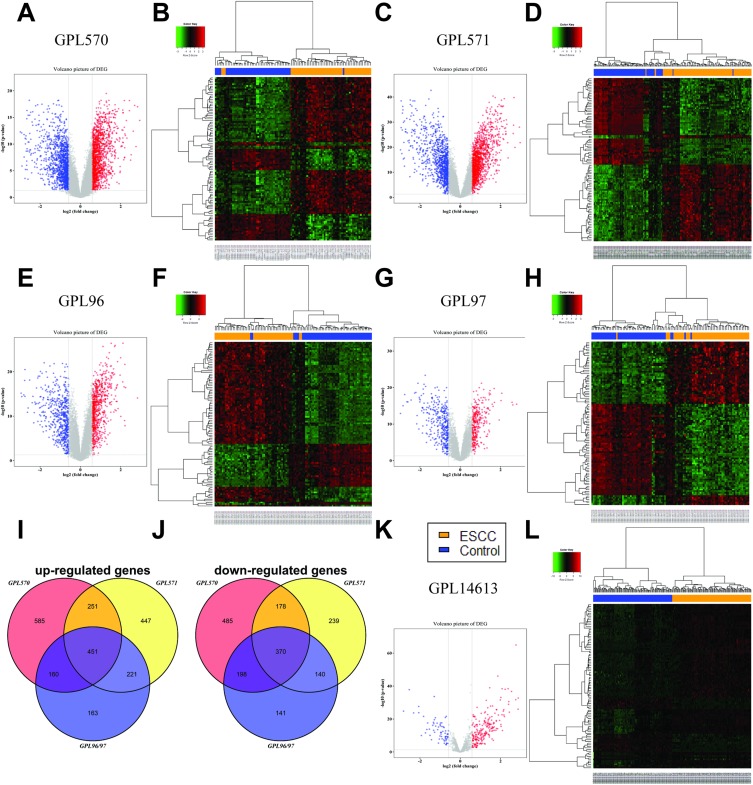
Figure 1.
Identification of differently expressed genes (DEGs) and microRNA (miRNA) in ESCC. Volcano map of differently expressed genes or miRNA between ESCC and normal tissues based on GPL570 (A), GPL571 (C), GPL96 (E), GPL97 (G), and GPL14613 (K). Heatmap of the top 50 up-regulated and 50 down-regulated genes or miRNA based on GPL570 (B), GPL571 (D), GPL96 (F), GPL97 (H), and GPL14613 (L). The Venn plot of up-regulated expressed protein-coding genes (I) and down-regulated expressed protein-coding genes (J).

