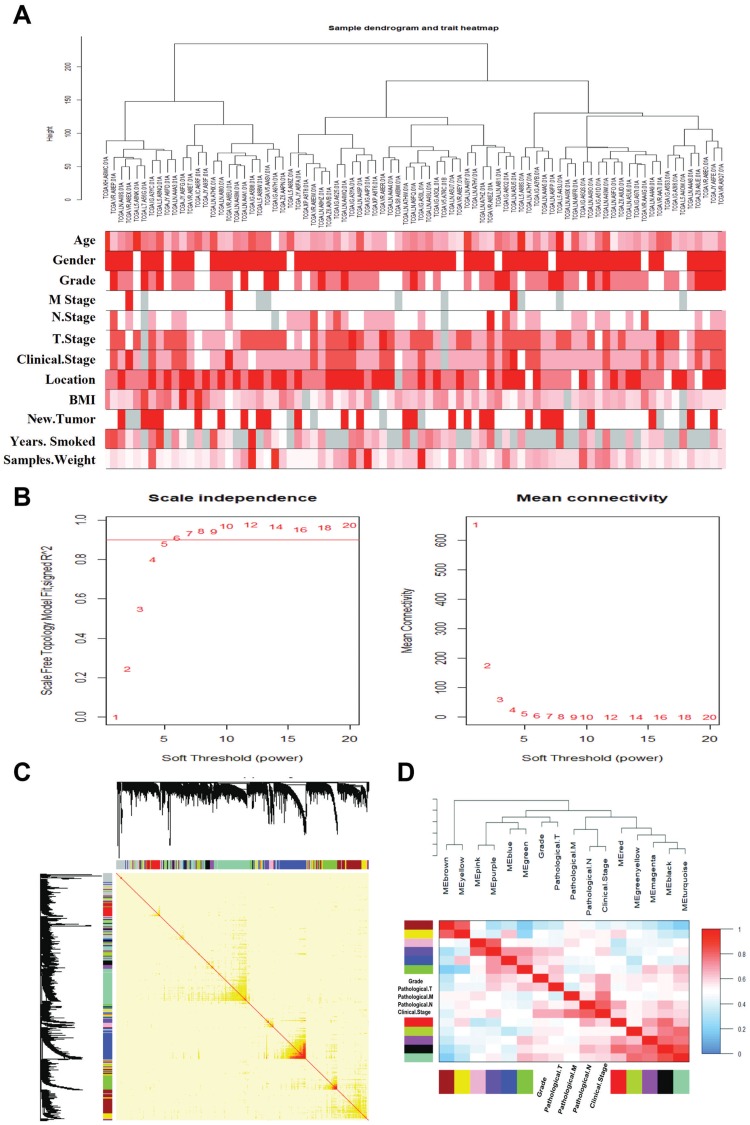
Figure 3.
WGCNA of esophageal squamous cell carcinoma. (A) Cluster result and clinic information of data samples. (B) Determination of soft threshold β of the adjacency function in the WGCNA algorithm. The left panel shows the scale-free topology fitting index (R2, y-axis) as a function of the soft-thresholding power (x-axis). The right panel displays the mean connectivity (degree, y-axis) as a function of the soft-thresholding power (x-axis). Red Arabic numerals in the panels denote different soft-thresholds. The red line in left panel means R2=0.9. There is a trade-off between maximizing scale-free topology model fit (R2) and maintaining a high mean number of connections. Thus, we set β=6. (C) Construction of the gene co-expression network. Each color represents a certain gene module. (D) Clustering tree based on the module eigengenes of modules.

