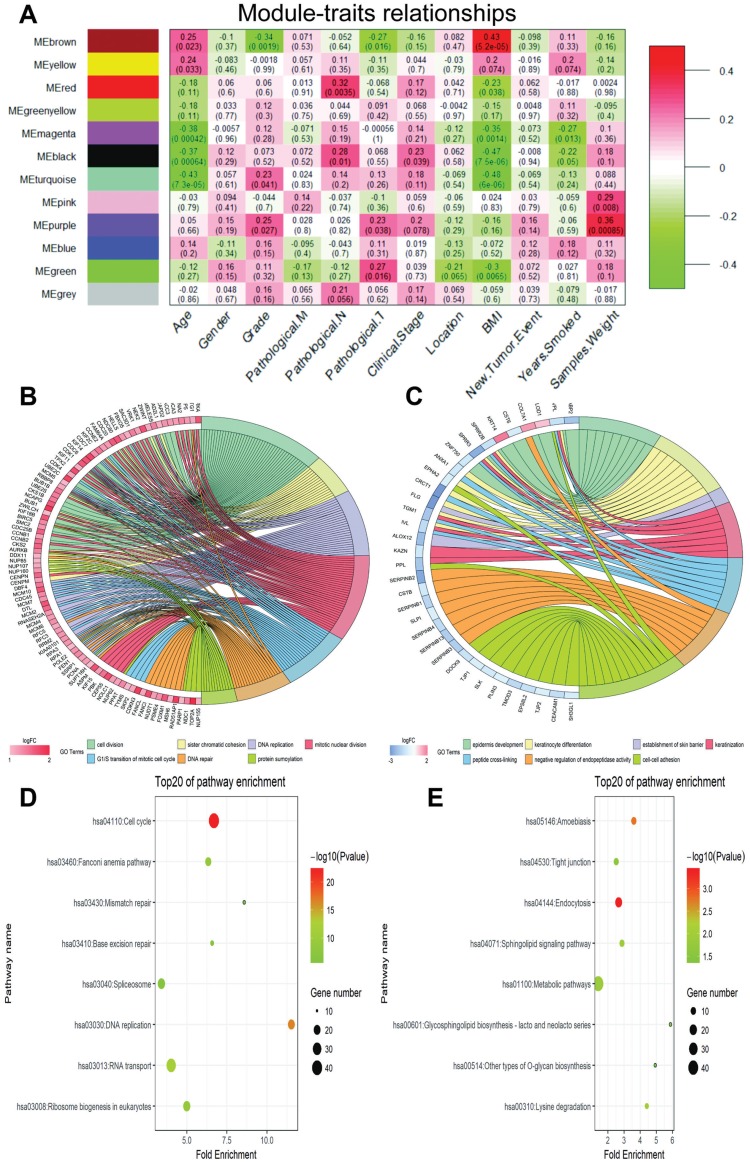
Figure 4.
WGCNA identified critical modules correlating with pathological parameters. (A) Correlation between modules and traits. The upper number in each cell refers to the correlation efficient of each module in the trait, and the lower number is the corresponding p-value. The top seven Gene Ontology (GO) biological process (BP) terms in the enrichment analysis of genes in the turquoise (B) and brown modules (C), the gene symbol listed in the figures were co.DEGs included in specific BP term; the top eight Kyoto Encyclopedia of Genes and Genomes (KEGG) pathways in the enrichment analysis of genes in the turquoise (D) and brown modules (E).

