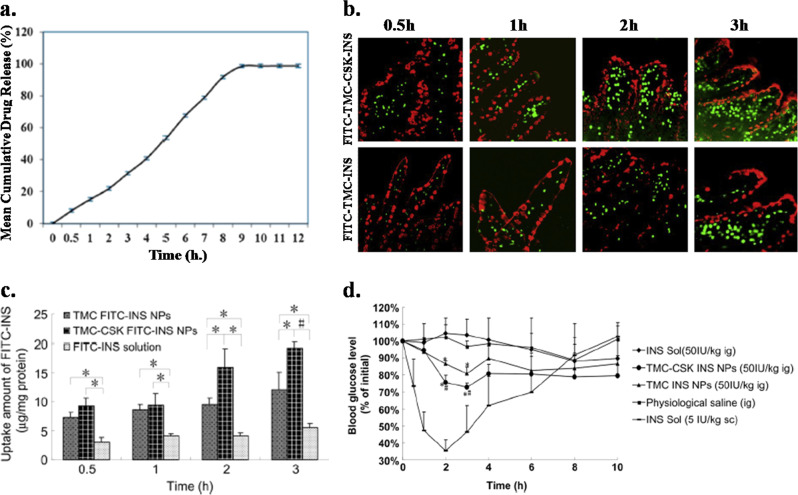
Fig. 2.
a In vitro drug release profile of insulin from PVA-alginate composite nanofiber patch. b Fluorescence images of the localization of FITC-TMC-CSK-INS and FITC-TMC-INS nanoparticles in the villi of the ileum after the indicated time, where green fluorescence represents FITC-loaded nanoparticles, while red fluorescence represents mucus droplets of goblet cells. c Quantification of the uptake of insulin-loaded nanoparticles and pure insulin by the HT29-MTX cells after different incubation times. (Mean ± SD, n = 3–5) *P < 0.05, #P < 0.001. d Glucose levels in the blood of diabetic rats at different time intervals after the oral administration of different nanoparticles and insulin. The insulin concentration was maintained at 50 IU/kg. (Mean ± SD, n ~4). Significant differences from insulin solution (*) and from TMC-INS nanoparticles (#): P < 0.05. Reproduced with permission from refs 85,86

