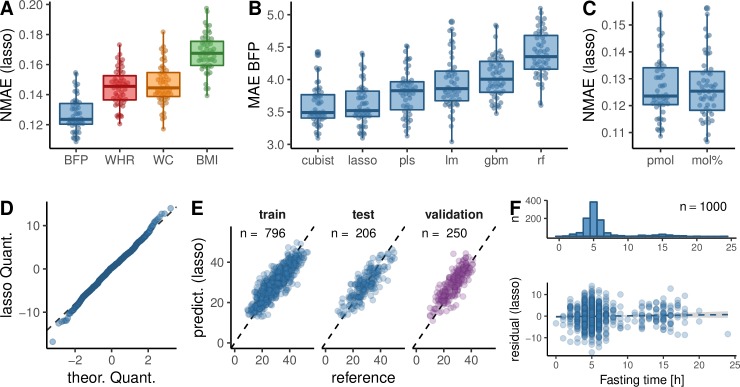
Fig 1. Regression of obesity measures by lipidome, age, and sex.
(A) The NMAE (MAE divided by the range from the 5th to 95th percentile; S2 Fig) of different obesity measures based on Lasso regression of molar amount data. Only subjects were used, for which all obesity measures were available. (B) MAE of BFP comparing different regression algorithms on molar lipid amount data (S7 Table). (C) Lasso based NMAE of BFP comparing direct molar amounts (pmol) to molar amounts standardized to the total lipid amount within a sample (mol%). A two-sided, unpaired Mann–Whitney U test resulted in a p-value of 0.99. (A–C) The summary statistics of a 5× repeated 10-fold cross validation of the FINRISK training data set (80% of the data set) are shown. (D) Quantile-quantile plot of the training residuals of the Lasso BFP model against a normal distribution. (E) Original BFP values (reference) in the FINRISK training, test, and the MDC-CC validation data set plotted against the prediction of Lasso regression based FINRISK training set. n signifies the number of samples in each set. (F) Histogram of fasting times of subjects in the FINRISK data set and scatter plot of the Lasso residuals against fasting time, including a linear model. The slope of the linear model had a p-value of 0.33. BFP, body fat percentage; BMI, body mass index; gbm, stochastic gradient boosting; lm, linear model; MAE, mean absolute error; MDC-CC, Malmö Diet and Cancer Cardiovascular Cohort; mol%, molar fraction; NMAE, normalized MAE; pls, partial least squares; pmol, picomol; rf, random forest; WC, waist circumference; WHR, waist-hip ratio.

