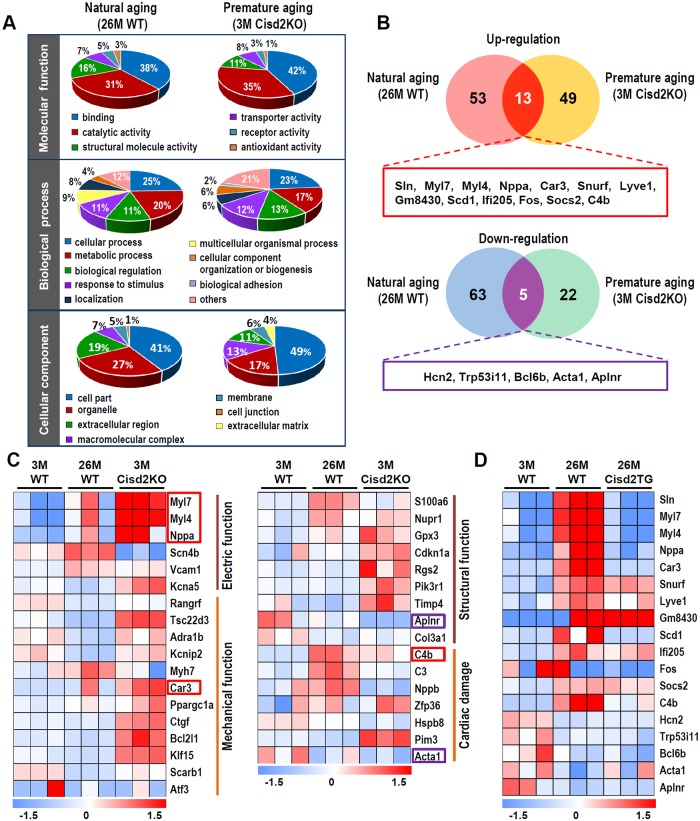
Fig 6. RNA sequencing analyses to examine the DEGs for the naturally and prematurely aged mice as well as the long-lived Cisd2TG mice.
(A) A pie chart according to their biological processes, molecular functions, and subcellular localization based on Gene Ontology annotation. (B) A Venn diagram illustrating the common and unique DEGs in the cardiac muscle of natural aging (26M WT versus 3M WT) and premature aging (3M Cisd2KO versus 3M WT). Numbers represent the amount of significantly changed genes (fold change > 1.5, p < 0.05) in each pairwise comparison and in their respective overlaps. Complete gene lists are provided in S7 Fig. (C) Classification of cardiac functional pathways by IPA illustrates the significant canonical pathways related to cardiac electric and mechanical functions, as well as cardiac structure and damage. Each column represents an animal sampled at depicted age. Hue represents the Z-score (RPKM minus mean over SD) of each gene (row) of 3M WT, 26M WT, and 3M Cisd2KO mice. The genes highlighted in red boxes (up-regulation) and purple boxes (down-regulation) are genes present in the common DEGs of natural aging and premature aging mice as shown in Fig 6B, respectively. (D) Comparison of the heatmaps of the common DEGs (up- and down-regulation), which were identified by comparing the DEGs of naturally and prematurely aged mice, for the young mice (3M WT), naturally aged mice (26M WT), and long-lived Cisd2TG mice (26M Cisd2TG). Values for each data point can be found in S1 Data. 3M, 3 months old; 26M, 26 months old; Cisd2KO, CDGSH iron-sulfur domain-containing protein 2 knockout; Cisd2TG, CDGSH iron-sulfur domain-containing protein 2 transgenic; DEG, differentially expressed gene; RPKM, reads per kilobase million; IPA, Ingenuity Pathway Analysis; Sln, sarcolipin; WT, wild type.

