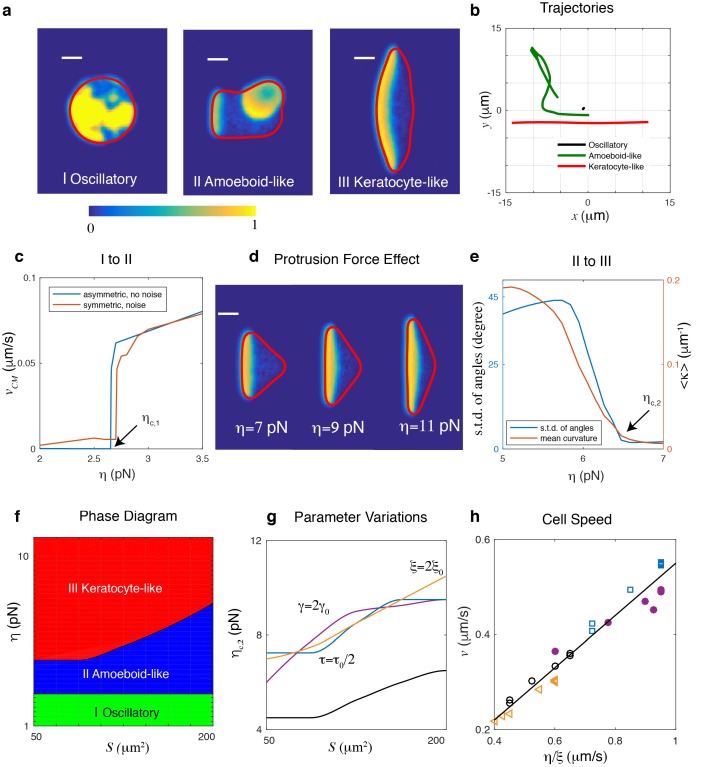
Figure 2. Different cell migration modes can be captured in the model by varying the protrusive strength .
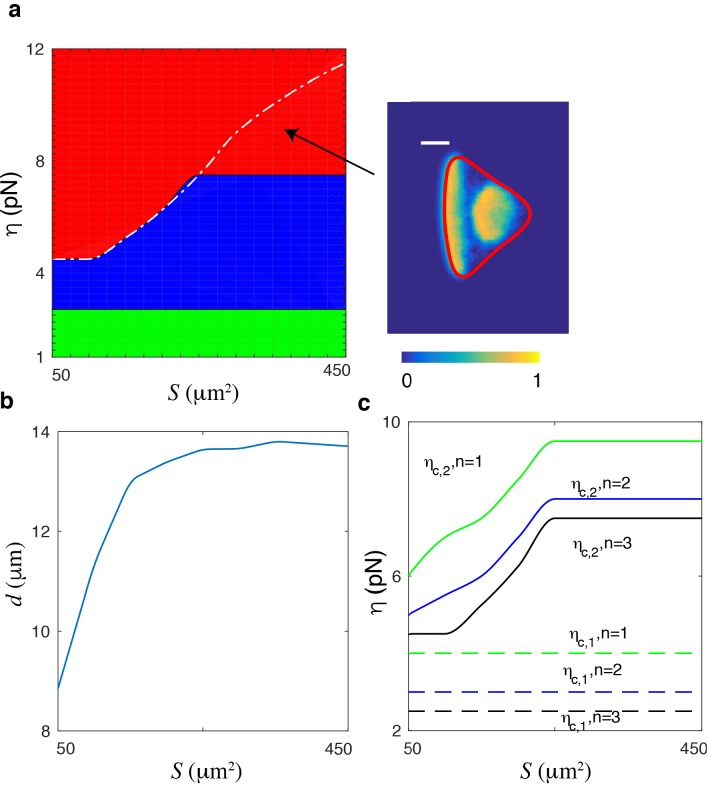
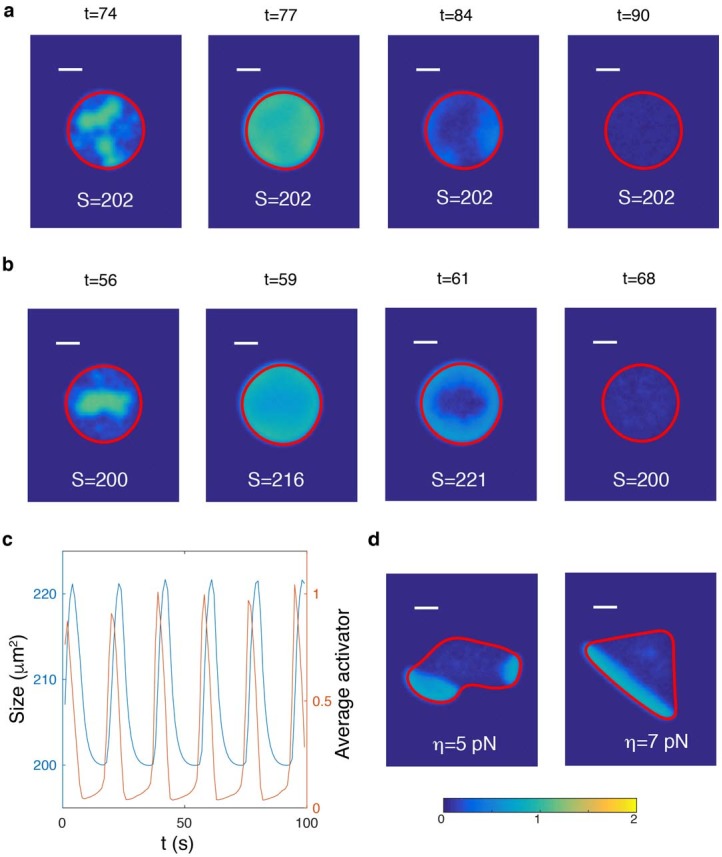
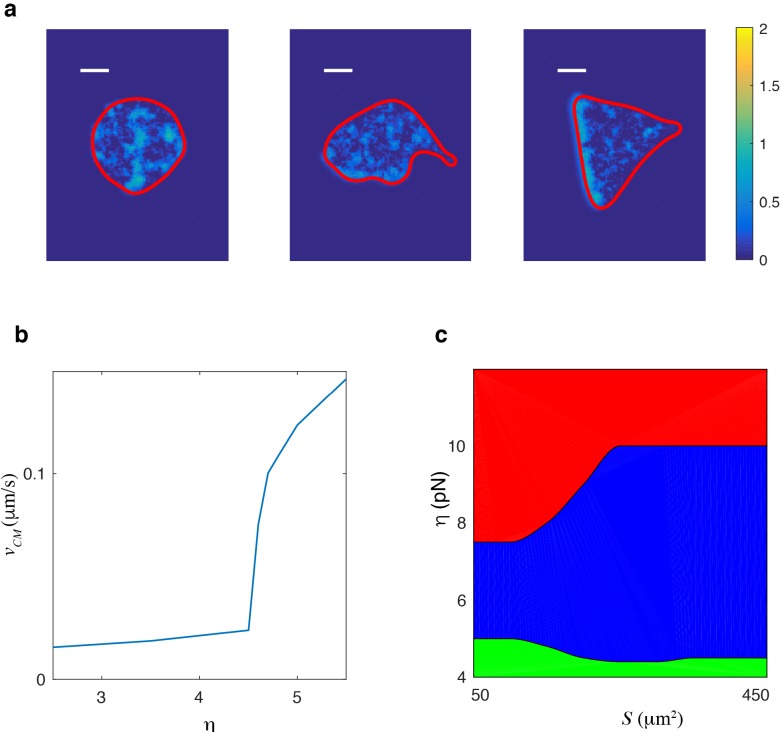
(a) Snapshots of a simulated cell showing (I) an oscillatory cell (), (II) an amoeboid-like cell (), and (III) a keratocyte-like cell (). All other parameters were assigned the default values and r = 8µm. Here, the activator concentration is shown using the color scale and the cell membrane is plotted as a red line (scale bar µm). (b) The trajectories of the three cells in (a). (c) The transition from oscillatory cell to amoeboid-like cell, with speed of the center of mass of a cell as a function of protrusion strength for r = 8µm. The red curve represents results from initial conditions where noise is added to a homogeneous and field while the blue curve corresponds to simulations in which the initial activator is asymmetric. Cells become non-motile at a critical value of protrusion strength, . (d) Increasing the protrusive force will result in flatter fronts in keratocyte-like cells and a decreased front-back distance. The simulations are carried out for fixed cell area . (e) The transition from amoeboid-like cell to keratocyte-like cell quantified by either the average curvature along a trajectory or the standard deviation of the angles of trajectory points as a function of protrusion strength (r = 8µm). Cell moves unidirectionally when the protrusion strength . (f) Phase diagram determined by systematically varying and the initial radius of the cell, . Due to strong area conservation, cell area is determined through . (g) The transition line of amoeboid-like cell to keratocyte-like cell for different parameter values. (h) The speed of the keratocyte-like cell as a function of . The black line is the predicted cell speed with , where . Symbols represent simulations using different parameter variations: empty circles, default parameters; triangles, ; filled circles, ; squares, .

