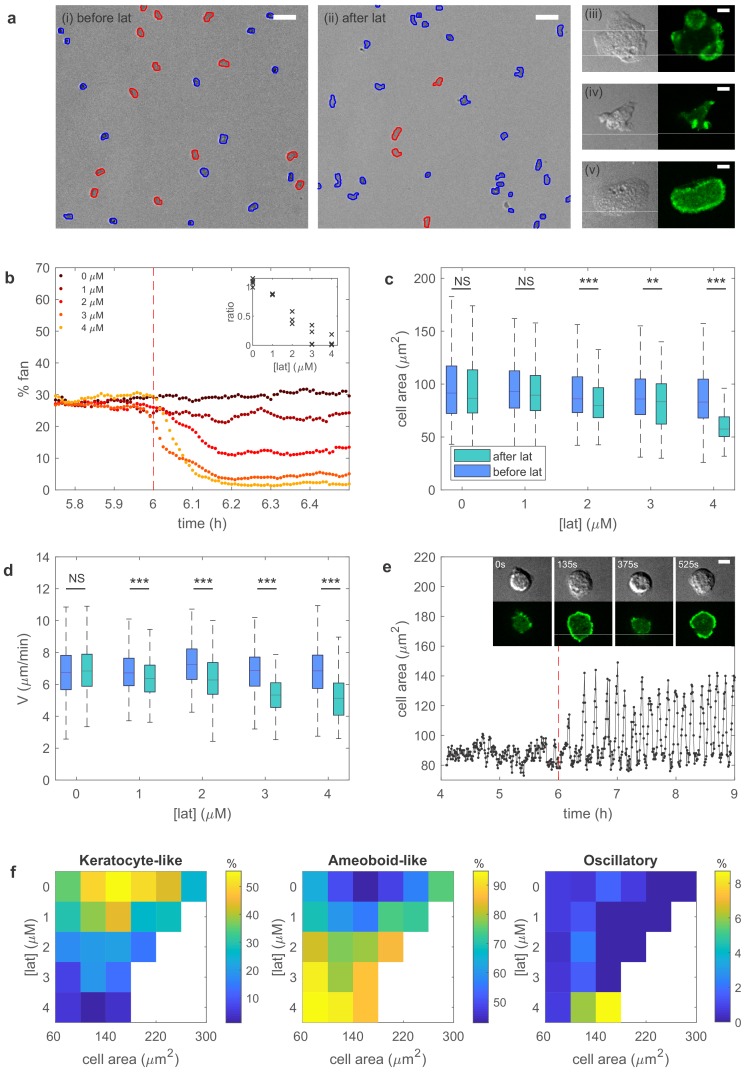
Figure 3. Experiments reveal different migration modes in Dictyostelium cells.
(a) Snapshot of starved Dictyostelium cells before (left) and after (right) exposure to latrunculin B. Amoeboid-like cells are outlined in blue while keratocyte-like cells are outlined in red (scale bar: 50 µm). The panels on the right show high magnification views of amoeboid-like (top two) and keratocyte-like cells in which the freshly polymerized actin is visualized with limE-GFP (scale bar: 5 µm). (b) Percentage of keratocyte-like cells as a function of time for different concentrations of latrunculin B (introduced at 6 hr, dashed line). Inset shows the ratio of keratocyte-like to all cells as a function of the latrunculin concentration for three repeats. (c) The cell area size of keratocyte-like cells before and after latrunculin exposure as a function of concentration. (d) The speed of keratocyte-like cells before and after latrunculin exposure as a function of concentration. (e) Basal cell area as a function of time for a cell that transitioned from amoeboid-like to oscillatory. Insets show snapshots of the cell at different time points (scale bar: 5 µm). (f) Percentage of cells in the keratocyte-like, amoeboid-like, and oscillatory mode of migration in the phase space spanned by cell area and latrunculin concentration. Percentage for each mode is visualized using the color bars. The number of cells for each data point varies between 7 and >1000 and white corresponds to a data point with fewer than seven total cells.


