. 2019 Oct 18;8:e43775. doi: 10.7554/eLife.43775

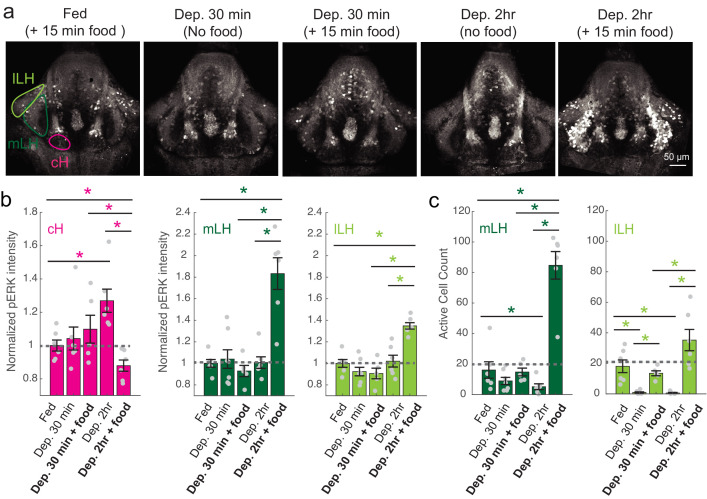
Figure 2. cH and LH activities are modulated by food and satiation state.

(a) Representative images showing that cH, mLH and lLH activities in the presence and absence of food vary with the extent of food deprivation (dataset quantified in b and c). (b) Normalized pERK average fluorescence intensity in cH significantly increases with food deprivation, and is significantly reduced when food is presented to food-deprived fish. Normalized mLH and lLH pERK average fluorescence intensity does not change significantly during food deprivation and strongly increases during voracious feeding (Dep. 2 hr + 15 min food). Asterisks denote p<0.05. Normalized pERK intensity (cH/mLH/lLH): Fed vs Dep. 30 min (p = 0.53/0.47/0.15), Fed vs Dep. 2 hr (p = 0.0022/0.41/0.59), Dep. 30 min + food vs Dep. 2 hr + food (p = 0.041/0.0022/0.0022), Dep. 30 min vs Dep. 30 min + food (p = 0.62/0.73/0.62), Dep. 2 hr vs Dep. 2 hr + food (p = 0.0022/0.0011/0.0022), Fed vs Dep. 2 hr + food (0.047/0.0011/0.0011). Anti-pERK staining fluorescence was averaged over each entire region of interest (i.e. cH, mLH and lLH; see Materials and methods for details). The normalized anti-pERK staining intensity for each region (ROI) was obtained by dividing the anti-pERK fluorescence from each fish (in all experimental groups) by the average anti-pERK fluorescence for the same ROI of continuously fed fish. (c) The number of active mLH and lLH cells declines within 30 min of food deprivation, and is significantly enhanced during feeding, particularly after a longer period of food deprivation. Active cell count (mLH/lLH): Fed vs Dep. 30 min (p = 0.155/5.8 × 10−4), Fed vs Dep. 2 hr (p = 0.047/0.011), Dep. 30 min + food vs Dep. 2 hr + food (p = 0.0022/0.0043), Dep. 30 min vs Dep. 30 min + food (p = 0.07/0.013), Dep. 2 hr vs Dep. 2 hr + food (p = 0.0011/0.0011), Fed vs Dep. 2 hr + food (p = 0.0022/0.07), n = 6/7/5/6/6 fish, one-tailed Wilcoxon rank-sum test. Data plotted in Figure 2 are provided in Figure 2—source data 1.

Figure 2—source data 1. Source data for plots displayed in Figure 2b-c.

Figure 2.

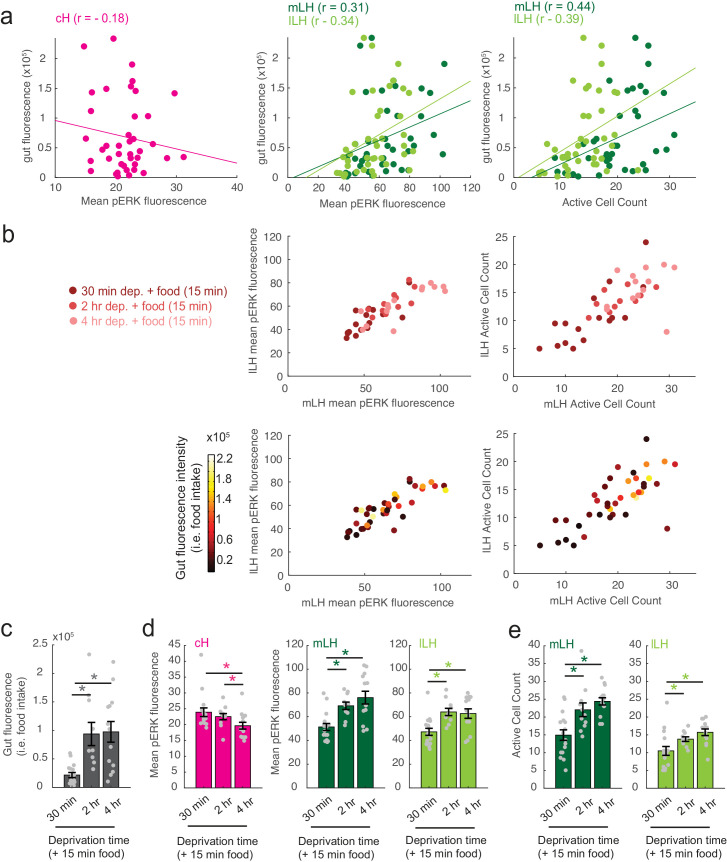
Figure 2—figure supplement 1. Modulation of cH, mLH and lLH activity in relation to feeding.

Figure 2—figure supplement 1.

The dataset (n = 41 fish) includes animals food-deprived for 30 min (n = 16), 2 hr (n = 11), or 4 hr (n = 14), and subsequently fed labeled paramecia for 15 min. Brains from these animals were individually-stained with anti-pERK antibody in multi-well plates in order to correlate each fish's food intake with cH, mLH and lLH neural activity. (a) Gut fluorescence (i.e. food intake) of all fish as a function of mean cH pERK fluorescence, mean LH (mLH and lLH) anti-pERK staining average fluorescence and active cell count. Mean pERK fluorescence reflects the average fluorescence within the cH, mLH or lLH regions of interest. This dataset was not normalized. Each datapoint represents an individual fish. (b) Top: mLH and lLH mean pERK fluorescence (left), and active cell count (right) of all fish (n = 41) plotted as a function of food deprivation time (denoted by color intensity). Bottom: mLH and lLH mean fluorescence (left) and cell count (right) of all fish (n = 41) plotted as a function of gut fluorescence (i.e. food intake) after 15 min of feeding (denoted by color intensity). (c-e) Quantification of gut fluorescence, cH and LH mean pERK fluorescence and LH active cell count across the different food deprivation times (30 min, 2 hr, and 4 hr). Note that in this dataset, because anti-pERK was conducted on each brain individually, there is higher variance between specimens and reduced statistical significance in cH quantification data (compare with Figure 2b, left panel). Asterisks denote p<0.05. (c) Food intake: After 30 min vs 2 hr dep. (p = 2.8×10⁻⁴), 30 min vs 4 hr dep. (p = 4.0×10⁻⁴), 2 hr vs 4 hr dep. (p = 0.56). Asterisk denotes p<0.05, n = 16/11/14 fish (30 min/2 hr/4 hr dep. + 15 min food), one-tailed Wilcoxon rank-sum test. (d) Mean pERK fluorescence (cH/mLH/lLH): After 30 min vs 2 hr dep. (p = 0.55/0.001/5.9 × 10−4), 30 min vs 4 hr dep. (p = 0.0084/8.6 × 10−4/0.0058), 2 hr vs 4 hr dep. (p = 0.02/0.24/0.54). Sample sizes as in (c). (e) Active cell count (mLH/lLH): After 30 min vs 2 hr dep. (p = 0.0073/0.0094), 30 min vs 4 hr dep. (p = 1.6×10⁻⁴/0.0017), 2 hr vs 4 hr dep. (p = 0.056/0.053). Sample sizes as in (c).