. 2019 Oct 18;8:e43775. doi: 10.7554/eLife.43775

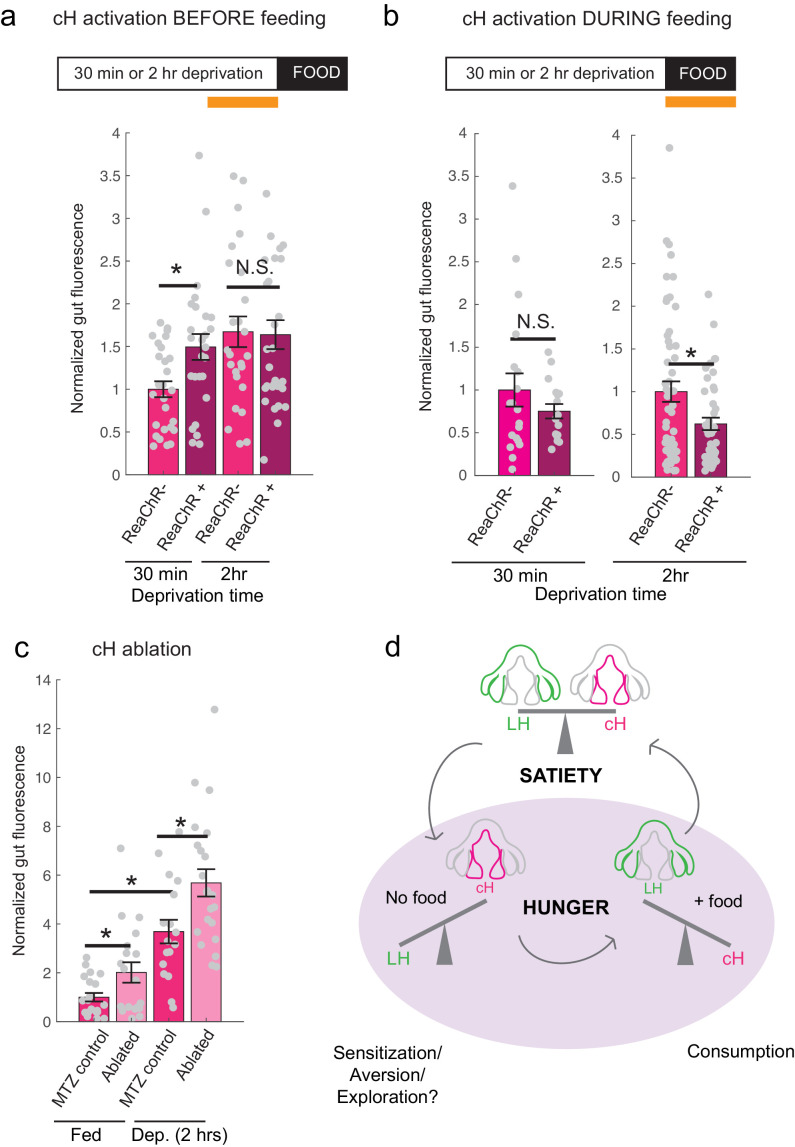
Figure 6. Role of the cH in behavioral control.

(a) Animals expressing the ReaChR transgene Tg(UAS:ReaChR-RFP) under control of the Tg(y333:Gal4) driver were exposed to 630 nm illumination (orange bar in schematic) for 10 min prior to feeding and assessed for subsequent ingestion of fluorescently labeled paramecia. Tg(y333:Gal4; UAS:ReaChR-RFP) stimulation increased food intake in 30 min food-deprived but not 2 hr food-deprived fish, during subsequent food presentation. Dep. (30 min): n = 27/26 (ReaChR-/ReaChR+), p = 0.005. Dep. (2 hr): n = 25/29 (ReaChR-/ReaChR+), p = 0.36, one-tailed Wilcoxon rank-sum test. Asterisks denote p<0.05. Since ReaChR expression via Tg(116A:Gal4) was negligible, we used another Gal4 (Tg(y333:Gal4)) line that is also specific to the cH when ReaChR is expressed. Fed and food-deprived fish were assayed simultaneously, thus all results were normalized to fed controls. ReaChR- controls do not have visible Tg(y333:Gal4;UAS:ReaChR-RFP) expression, and thus are a mixture of siblings expressing Tg(y333:Gal4) only, Tg(UAS:ReaChR-RFP) or neither of these transgenes, each with ⅓ probability. (b) Left: Optogenetic activation of Tg(y333:Gal4; UAS:ReaChR-RFP) fish (orange bar in schematic) during feeding in fish that were food-deprived for 30 min does not significantly reduce food intake: n = 19/16 (ReaChR-/ReaChR+), p = 0.44 (N.S.); Right: Optogenetic activation of Tg(y333:Gal4; UAS:ReaChR-RFP) fish during feeding in 2 hr food-deprived fish reduces food intake: n = 53/44 (ReaChR-/ReaChR+), p = 0.042. Since 30 min and 2 hr food-deprived fish were assayed in different experiments, gut fluorescence normalized to their respective controls, one-tailed Wilcoxon rank-sum test. (c) Nitroreductase-mediated ablation of the cH in Tg(116A:Gal4;UAS:nfsb-mCherry)-positive or negative fish treated with metronidazole (MTZ) from 5 to 7 dpf significantly enhances food intake in 8 dpf fish. p = 0.0042/0.041/1.4 × 10−5 (fed control vs fed ablated, 2 hr dep. control vs 2 hr dep. ablated, fed vs 2 hr dep.), n = 29 (fed control)/28 (fed ablated)/22 (dep. control)/29 (dep. ablated), two-tailed Wilcoxon rank-sum test. Controls do not have visible Tg(116A:Gal4;UAS:nfsb-mCherry) expression, and thus are a mixture of siblings expressing Tg(116A:Gal4) only, Tg(UAS:nfsb-mCherry) or neither of these transgenes, each with ⅓ probability. (d) Schematic summarizing our results. We propose distinct roles of the cH during hunger, depending on the presence or absence of food. See Appendix 1 – Conceptual Circuit Model for elaboration. Data plotted in Figure 6 are provided in Figure 6—source data 1.

Figure 6—source data 1. Source data for plots displayed in Figure 6a-c.

Figure 6.

Figure 6—figure supplement 1. ReaChR activation by whole-field optogenetic illumination.

Figure 6—figure supplement 1.

(a) Tg(y333:Gal4;UAS:ReaChR-RFP) (magenta) optogenetic stimulation during feeding is sufficient to induce pERK activity (green) in many transgene-positive neurons. Fish were food-deprived for 2 hr and then fed in the presence of whole-field 630 nm LED illumination (as in Figure 6). White arrows indicate examples of cells with higher pERK activity. Scale bar = 20 μm. Insets (white boxes) are shown at higher magnification on the right. Width of insets = 40 μm. (b) The pERK intensities of ReaChR-positive and -negative cells (normalized to the mean pERK intensity of ReaChR-negative cells for each fish) are plotted for three individual fish. To sample ReaChR-negative cells, all visible cells lacking red channel expression were selected in every 3rd to 5th z-plane (to minimize oversampling). Fish one corresponds to the fish in (a). Box plot indicates mean value (horizontal line), 1 SD (gray box) and 95% confidence intervals (vertical line). Individual cells are plotted as circles. In Tg(y333:Gal4;UAS:ReaChR-RFP) transgene-positive fish, ReaChR positive cells have significantly higher pERK fluorescence intensity, demonstrating the effectiveness of optogenetic activation (p = 2.7×10⁻⁶/2.7 × 10−8/6.5 × 10−13 for each fish respectively, one-tailed Wilcoxon rank-sum test).
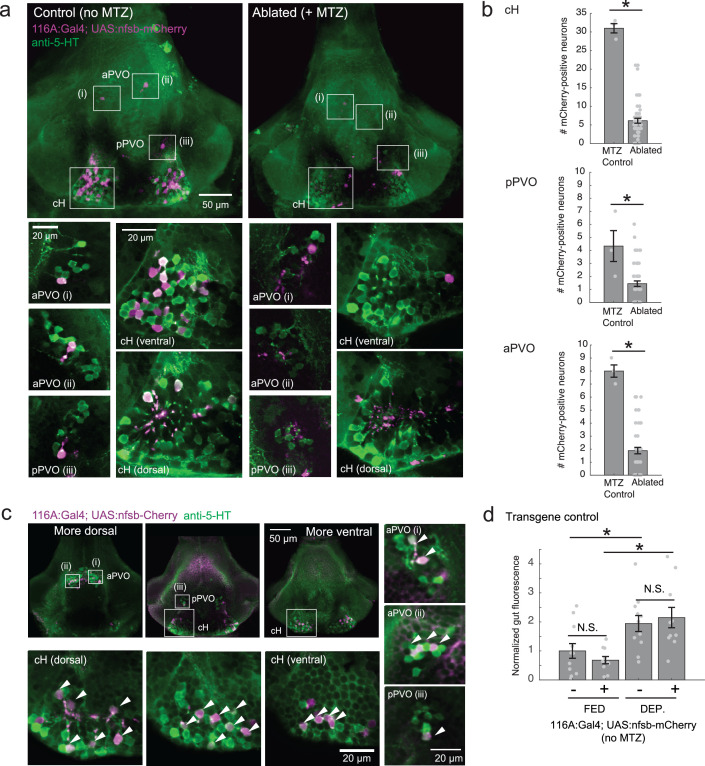
Figure 6—figure supplement 2. Nitroreductase-mediated ablation of cH serotonergic neurons.

Figure 6—figure supplement 2.

(a) Ablation of Tg(116A:Gal4;UAS:nfsb-mCherry)-labeled neurons. Note that due to sparse expression of the transgenes, ablation of the cH/PVO populations is likely to be partial (<50%). Representative projection images are shown of non-ablated animals (left) and animals following exposure to the chemical MTZ (right, see Materials and methods). Scale bar = 50 μm. Insets (white boxes) show the locations of higher-magnification single-plane images of transgene-labeled cH, aPVO and pPVO areas and neuronal overlap with 5-HT expression (anti-5-HT antibody staining, green color). Scale bar = 20 μm. (b) Quantification of ablation efficiency. When Tg(116A:Gal4;UAS:nfsb-mCherry) fish were incubated with MTZ, we observed 6.1 ± 0.66 (mean ± SEM) mCherry-positive cells (n = 54 fish). When MTZ was omitted, 31 ± 1.5 cells were mCherry-positive (n = 3 fish). The reduction resulting from ablation was thus ~80% (p = 0.0019, one-tailed Wilcoxon rank-sum test). pPVO (4.3 ± 1.5 control vs 1.4 ± 0.2 ablated, p = 0.0162) and aPVO (8.0 ± 0.6 control vs 1.9 ± 0.3 ablated, p = 0.0015) cells were also affected. Some of the remaining mCherry-positive cells were dimly fluorescent and misshapen/deformed, indicating damage that might impair function. (c) Similar to Tg(116A:Gal4;UAS:GFP) (Figure 3—figure supplement 1), there is strong overlap of Tg(116A:Gal4;UAS:nfsb-mCherry) with anti-5-HT immunostaining (green color). Scale bar = 50 μm. Insets (white boxes) show higher-magnification single-plane images of cH, aPVO and pPVO labeling by this transgene and overlap with 5-HT expression. Scale bar = 20 μm. (d) The Tg(116A:Gal4;UAS:nfsb-mCherry) transgene does not affect feeding in the absence of MTZ, relative to siblings lacking transgene expression. Fed: p = 0.64, n = 11(negative)/10(positive); Dep.: p = 0.91, n = 11(negative)/10(positive), Fed vs Dep.: p = 0.035(negative)/7.7 × 10−4(positive), two-tailed Wilcoxon rank-sum test.