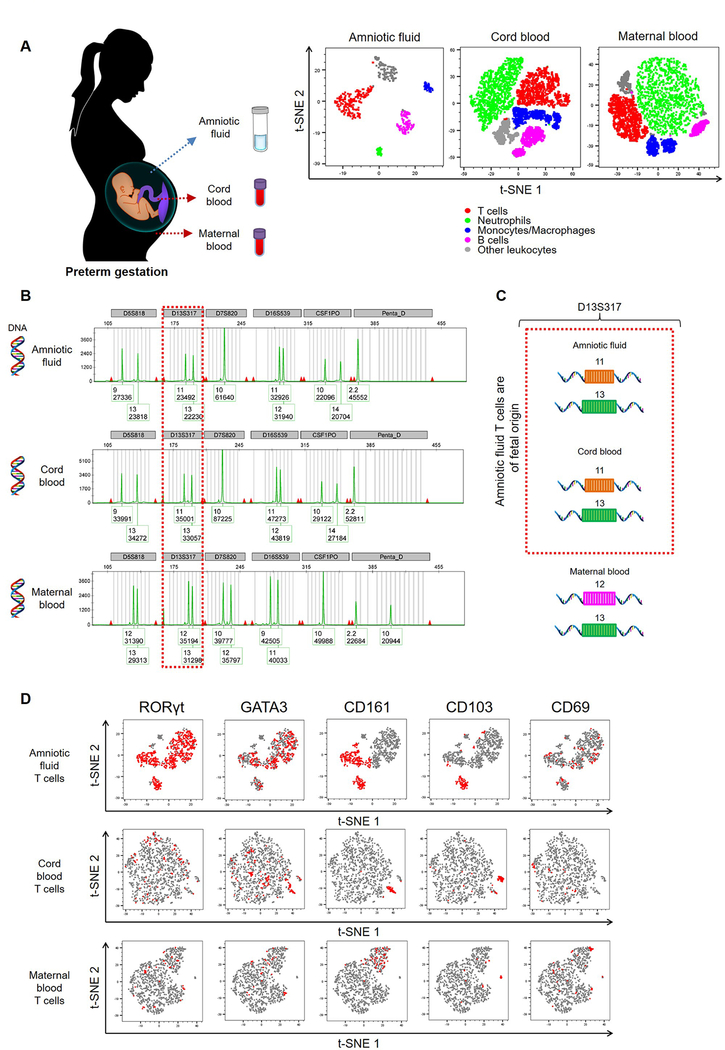
Figure 1. Characterization and origin of amniotic fluid T cells.
(A) (Left) Amniotic fluid samples were obtained from women between 15–30 weeks of gestation for exploratory studies. Maternal peripheral blood and umbilical cord blood samples were collected from each case for comparison. (Right) Representative t-SNE plots showing the relative distribution of immune cell populations in amniotic fluid, umbilical cord blood, and maternal peripheral blood (n = 3 – 14 each). (B) DNA fingerprinting of amniotic fluid cells, the fetus (umbilical cord blood), and the mother (peripheral blood) is shown in electropherograms. Each electropherogram contains 6 genetic sites: D5S818, D13S317, D7S820, D16S539, CSF1PO, and Penta_D. Each genetic site has STR alleles, which are represented by peaks. The numbers below each STR allele (peak) are the number of repeats and the signal strength for each STR allele. The DNA fingerprinting of the amniotic fluid cells is identical to the DNA fingerprinting of the fetus. (C) A representative comparison between the D13S317 STR alleles expressed by amniotic fluid cells, the fetus, and the mother is shown. (D) Representative t-SNE plots showing the expression patterns of RORγt, GATA3, CD161, CD103, and CD69 on T cells (CD45+CD14-CD15-CD3+ cells) from amniotic fluid, cord blood, or maternal peripheral blood. Red represents the expression of the indicated marker, and grey indicates no expression. Demographic and clinical characteristics of the study population are shown in Table I.

