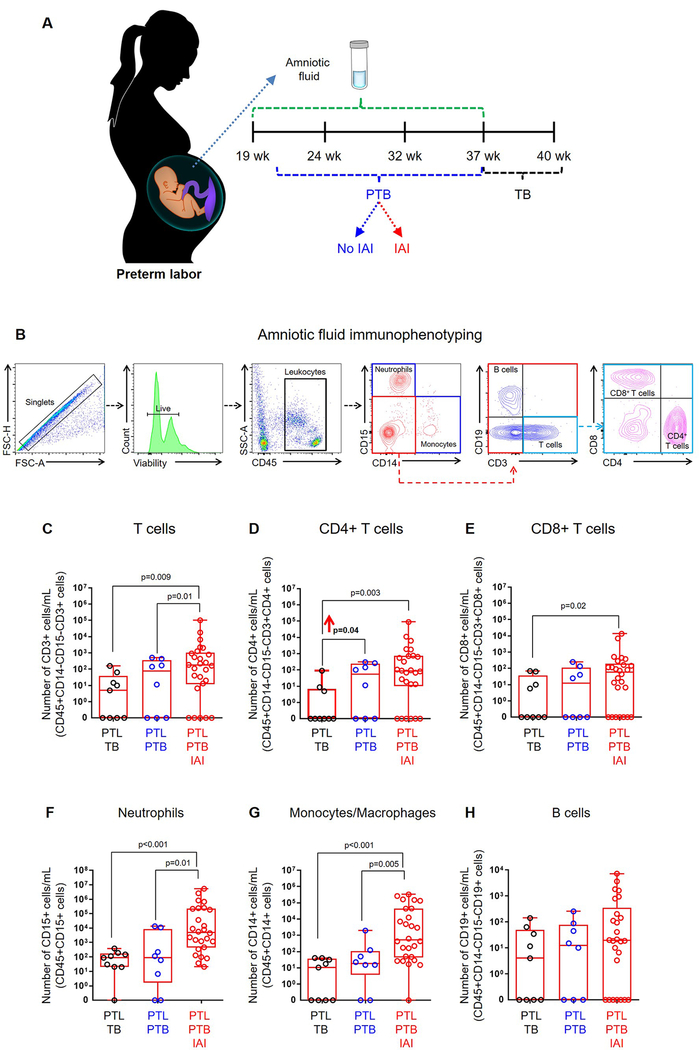
Figure 2. Amniotic fluid T cells are increased in preterm labor and birth.
(A) Amniotic fluid samples were obtained from women with preterm labor who delivered at term (PTL-TB) (negative control), women with preterm labor who delivered preterm without intra-amniotic inflammation (PTL-PTB) (study group), and women with preterm labor who delivered preterm with intra-amniotic inflammation (PTL-PTB-IAI) (positive control). (B) Flow cytometry gating strategy for immunophenotyping of immune cells. Immune cells were initially gated within the viability gate and CD45+ gate followed by lineage gating for neutrophils (CD45+CD15+ cells), monocytes/macrophages (CD45+CD14+ cells), T cells (CD45+CD3+ cells) that were subsequently gated for CD4+ T cells (CD45+CD3+CD4+ cells) and CD8+ T cells (CD45+CD3+CD8+ cells), and B cells (CD45+CD19+ cells). The numbers of (C) total T cells, (D) CD4+ T cells, (E) CD8+ T cells, (F) neutrophils, (G) monocytes/macrophages, and (H) B cells in amniotic fluid. Data are shown as box-and-whisker plots where midlines indicate medians, boxes indicate interquartile ranges, and whiskers indicate minimum and maximum ranges. Demographic and clinical characteristics of the study population are shown in Table II.

