. 2019 Oct 9;8:e51603. doi: 10.7554/eLife.51603

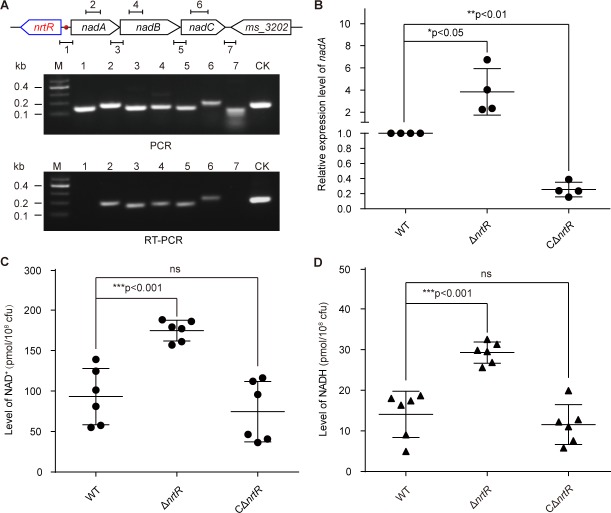
Figure 4. NrtR is a repressor for the nadABC operon that is responsible for NAD+ and NADH concentration in M. smegmatis.

(A) Genetic organization and transcriptional analyses of the nrtR and its neighboring de novo NAD+ synthesis genes. The arrows represent open reading frames, and the numbered short lines (1 to 7) represent the specific PCR amplicons that were observed in the following PCR and RT-PCR assays (in the bottom panels). PCR and RT-PCR were applied to analyze the transcription of the putative NADde novo synthesis loci. The primer numbering was identical to that shown in the top panel. CK (control) denotes the 16S rDNA. (B) RT-qPCR analyses of nad operon expression in the wild-type strain and in the ΔnrtR mutant and nrtR complementary strains. RT-qPCR experiments were performed at least three times and the data were expressed as means ± standard deviations (SD). The p-value was calculated using one-way ANOVA along with Tukey's test. *p<0.05 and **p<0.01. Comparison of the intra-cellular level of NAD+ (C) and NADH (D) among the WT, ΔnrtR and CΔnrtR strains. Each dark circle or triangle represents an independent experiment. The data are shown as means ± SD. The statistical significance of differences among WT, ΔnrtR and CΔnrtR was determined by Student’s t test and by ANOVA with heterogeneous variances. ***p<0.001; ns, no significant difference.

Figure 4.

Figure 4—figure supplement 1. In vivo evidence that MsNrtR is an auto-repressor.
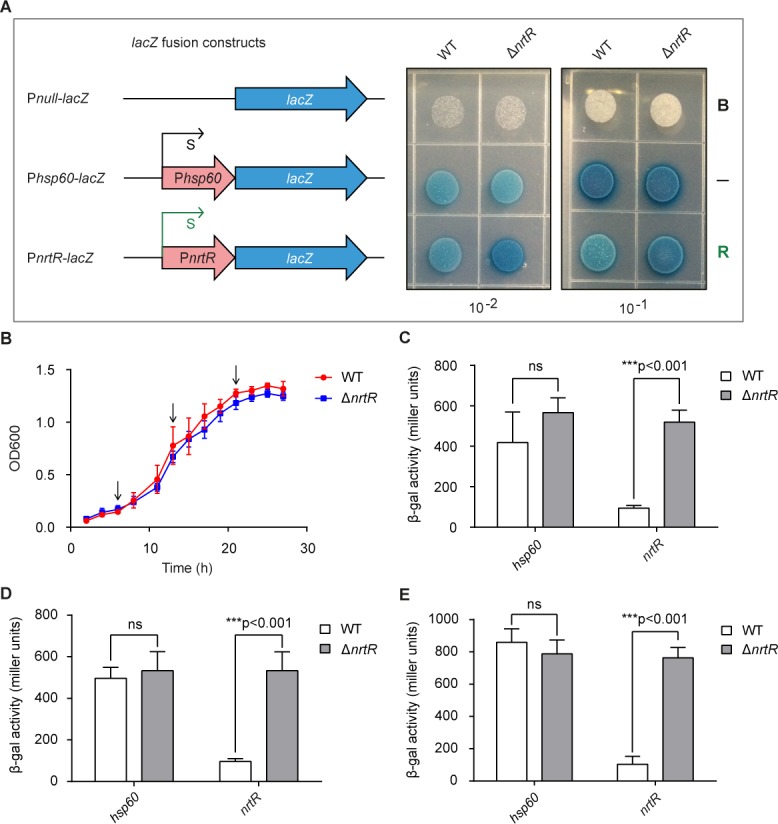
Figure 4—figure supplement 1.

(A) LacZ-based visualization of the auto-regulation of NrtR in M. smegmatis. Left column: schematic representation of promoter-lacZ transcriptional fusions. A promoter-less LacZ refers to the blank control (abbreviated as ‘B’); the hsp60 promoter-fused LacZ acts as the negative control (indicated by ‘–'); and the nrtR promoter-driven LacZ is used to evaluate the regulatory role of the NrtR repressor (highlighted with ‘R’). Right column: the exponentially growing M. smegmatis cultures of the wild-type and ΔnrtR strains were diluted appropriately and spotted onto 7H10 plates containing 50 μg/ml kanamycin and 50 mg/ml X-gal. The plates were incubated at 37°C for 48 hr. (B) Growth curves of WT and nrtR deletion strains carrying a transcriptional fusion plasmid, pMV261-promoter-lacZ. Cultures were grown in LB medium supplemented with 0.5% glycerol, 0.05% tween 80, and 50 mg/ml kan at 37°C, 220 rpm, and absorbance at 600 nm was recorded at 2 hr intervals for 28 hr. (C) Transcriptional levels of nrtR in lag-phase cultures of the wild-type and in the ΔnrtR mutant of M. smegmatis, evaluated using lacZ-transcriptional fusions. A LacZ controlled by the hsp60 promoter acts as the negative control. Results are expressed as an average ± standard deviation (SD) from no less than three independent tests. (D) Transcriptional levels of nrtR in exponential-phase cultures of wild-type and nrtR-deleted strains of M. smegmatis, evaluated using lacZ-transcriptional fusions (E) Transcriptional levels of nrtR in stationary-phase cultures of wild-type M. smegmatis and its nrtR deletion mutant, evaluated using lacZ-transcriptional fusions. Data are presented as mean ± SD. The p-value was measured using one-way ANOVA along with Tukey's test. **, p<0.01; ***, p<0.001.