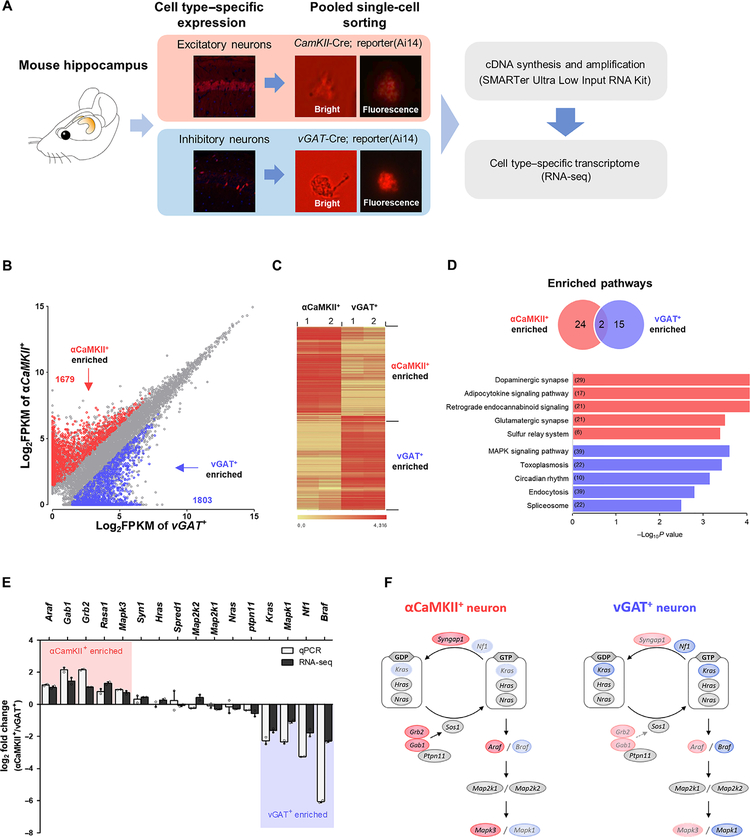
Fig. 4. Cell type–specific transcriptome analyses reveal differential expressions of RAS signaling molecules.
(A) Workflow for cell type–specific transcriptome analysis. cDNA, complementary DNA. (B) Scatterplot illustrating genes enriched in αCaMKII+ neurons (red, 1679 transcripts) or in vGAT+ neurons (blue, 1803 transcripts) out of 11,554 transcripts. (C) Unsupervised hierarchical clustering analysis based on Pearson’s correlation of normalized fragments per kilobase million (FPKM) values shows clear segregation between two cell types. (D) Kyoto Encyclopedia of Genes and Genomes (KEGG) pathway enrichment analysis of 3482 DEGs. Venn diagram indicates a comparison of KEGG pathways enriched in two neuronal types. The bar graph indicates the top five KEGG pathways that are enriched in αCaMKII+ neurons (red bar) and in vGAT+ neurons (blue bar). The numbers of genes in each pathway are indicated in the bars. (E) Validation of RNA-seq data. Expression of genes were represented by log2 FC (fold change, αCaMKII/vGAT) of FPKM value and by log2 FC of ΔCt values normalized to β-actin level. The qRT-PCR and RNA-seq results represent the means of biological duplicates, which have technical triplicates. Red shading indicates enriched genes in αCaMKII+ neurons, and blue shading indicates enriched genes in vGAT+ neurons. (F) A schematic of RAS-ERK signaling in excitatory and inhibitory neurons based on the transcriptome data (genes take the place of proteins in the pathway). Genes in red are enriched in αCaMKII+ neurons, genes in blue are enriched in vGAT+ neurons, and gray represents similarly expressed genes.

