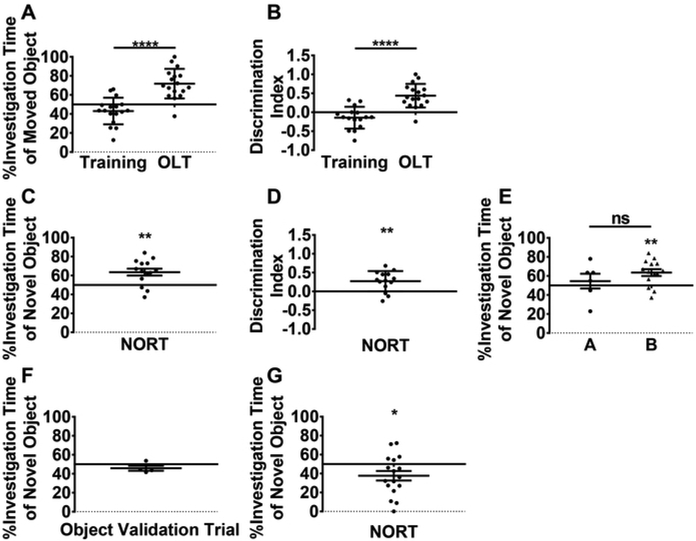
Figure 3: Behavioral testing data with wild type adult C57Bl/6 mice.
(A) Comparison of percent total investigation time of the moved object during the training trial versus the OLT shows significant increase in investigation, after the object moved. ****p < 0.0001, paired t-test. (B) Representative results for moved object investigation during training and OLT trials displayed as a discrimination index similarly show a significant increase in investigation of the object after it is moved. ****p < 0.0001, paired t-test. (C) Percent total investigation time of the novel object in the NORT shows significant preference for investigating the novel object. **p = 0.0024, one-sample t-test vs. 50%. (D) Representative results for novel object investigation in the NORT displayed as a discrimination index similarly show preference for investigating the novel object. **p = 0.0024, one-sample t-test vs 0. (E) Representative results of a NORT analysis involving two different groups of mice. Group B differs significantly from 50% by one-sample t-test (**p = 0.0024), but group A does not (p = 0.5837). In a separate analysis, to compare groups, a two-sample Mann-Whitney test is used because of the uneven group sizes and no significant difference in investigation is found (p = 0.66, ns). (F) Percent time with an object during validation trials in a small sample size shows a trend towards aversion to the object. p = 0.2159, one-sample t-test. (G) With a larger sample size and the object from (F) used as a novel object in a NORT, a significant aversion to the object is found, even though it is the novel object. *p = 0.0270, one-sample t-test. This is an example of a technical failure in object selection. Data are presented as mean ± SEM. Data from panels C-E are adapted from a previous publication6.

