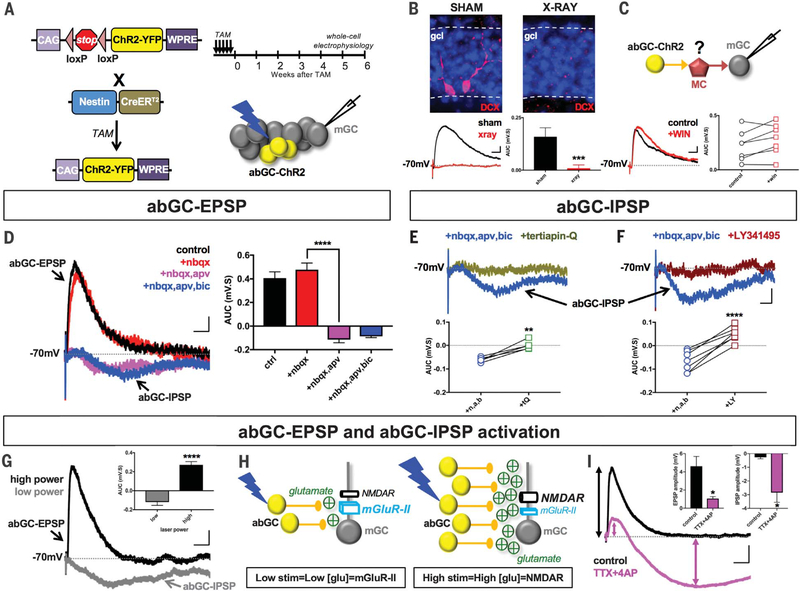
Fig. 2. Pharmacological analysis of abGC-mediated excitation and inhibition of mGCs.
(A) Breeding strategy and TAM-induction schedule for Nes-ChR2-YFP mice. Experimental protocol: abGCs were optogenetically stimulated (473-nm blue laser; 1-ms pulse) and evoked responses recorded in mGCs. YFP, yellow fluorescent protein. (B) Doublecortin (DCX) labeling in sham versus X-irradiated mice. Sham = 0.16 ± 0.04 mV·s, n = 9; x-ray = 0.01 ± 0.02 mV·s, n = 7. Unpaired t test ***P < 0.001. All stimulus artifacts indicate onset of laser pulse. (C) Inhibiting MC transmission with WIN 55,212–2 (5 μM) did not block abGC-evoked EPSPs. Control = 0.22 ± 0.05 mV·s, n = 7; WIN = 0.28 ± 0.05 mV·s, n = 7. Paired t test P = 0.08. (D) APV (50 μM), not NBQX (20 μM), inhibited abGC-EPSPs and unmasked bicuculline (BIC; 20 μM)–insensitive abGC-IPSPs. One-way analysis of variance (ANOVA), F3,58 = 47.12 (P < 0.0001). Control (ctrl) = 0.41 ± 0.05 mV·s, n = 17; +NBQX = 0.48 ± 0.06 mV·s, n = 17; +NBQX,APV = −0.11 ± 0.03 mV·s, n = 17; +NBQX,APV,BIC = −0.09 ± 0.01 mV·s, n = 8. Fisher’s least significant difference (LSD) post hoc test: Control × NBQX P = 0.26; control × NBQX,APV P < 0.0001; control × NBQX,APV,BIC P < 0.0001; NBQX × NBQX,APV ****P < 0.0001; NBQX × NBQX,APV,BIC P < 0.0001; NBQX,APV × NBQX,APV,BIC P = 0.72. (E and F) abGC-IPSPs were blocked by Tertiapin-Q (0.75 μM) [+NBQX,APV,BIC (n,a,b) = −0.06 ± 0.00 mV·s, n = 5; + Tertiapin-Q = 0.00 ± 0.01 mV·s, n = 5; paired t test **P < 0.01] and LY3414955 (LY; 0.5 μM) (+NBQX, APV, BIC = −0.07 ± 0.02 mV·s, n = 7; +LY341495 = 0.05 ± 0.01 mV·s, n = 7; paired t test ****P < 0.0001). (G) abGC-IPSPs were recorded at low (~2 mW) and abGC-EPSPs at high (~5 mW) laser power. (H) Model of mGlu-II and NMDAR activation in mGCs based on glutamate released by small versus large numbers of abGCs. (I) abGC-evoked EPSP and IPSP amplitudes before and after bath application of TTX (1 μM) and 4-AP (1 mM). EPSP: control = 4.61 ± 1.09 mV, n = 8; TTX+4AP = 1.07 ± 1.09 mV, n = 8; paired t test *P < 0.05. IPSP: control = −0.27 ± 0.11, n = 8; TTX+4AP = −2.85 ± 0.71, n = 8; *P < 0.05. Scale bars: 0.5 mV, 25 ms [(B) and (C)]; 0.25 mV, 50 ms [(D) to (F)]; 1 mV, 50 ms [(G) and (I)]. All values = mean ± SEM.

