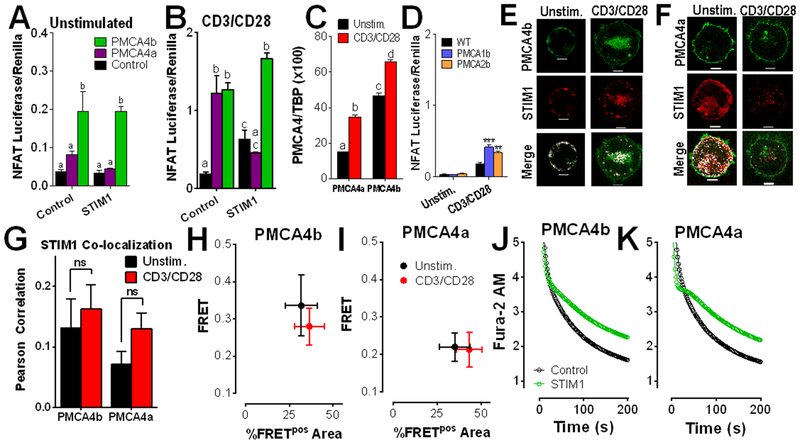
Figure 1: PMCA4 expression increases NFAT activity in a splice variant- and STIM1-dependent manner.
(A and B) Luciferase assay analysis of NFAT activity in Jurkat T cells transfected with vectors encoding NFAT4-IFN-luciferase, Renilla and control, PMCA4a, or PMCA4b, then left unstimulated (A) or stimulated with antibodies against CD3 and CD28 (B) for 6 hrs. Data are means ± SEM from 3 independent experiments performed in triplicate. (A) Statistical significance was assessed by two-way ANOVA; p<0.0001 for PMCA4, p>0.05 for STIM1, and p>0.05 for interdependence between PMCA4 and STIM1. Statistically significant groups are indicated by a, b (p < 0.05). (B) Statistical significance was assessed by two-way ANOVA; p<0.0001 for PMCA4, p>0.05 for STIM1, and p<0.0001 for interdependence between PMCA4 and STIM1. Statistically significant groups are indicated by a, b, c (p < 0.05). (C) qRT-PCR analysis of the ratio of PMCA4 to TBP expression in Jurkat T cells stimulated with antibodies against CD3 and CD28, as indicated for 2 hours. Statistical significance was assessed by two-way ANOVA; p<0.0001 for PMCA4a, p<0.0001 for PMCA4b and p>0.05 for interdependence between PMCA4 isoform expression and CD3/CD28. Statistically significant groups are indicated by a, b, c and d (p < 0.05). (D) Luciferase assay analysis of NFAT activity in Jurkat T cells transfected with vectors encoding NFAT4-IFN-luciferase, Renilla and control, PMCA1b, or PMCA2, then stimulated as indicated. Data are means ± SEM from 3 independent experiments performed in triplicate. Statistical significance was assessed by two-way ANOVA; p<0.0001 for PMCA expression, p<0.0001 for the effect of CD3/CD28 and p>0.00001 for interdependence between PMCA isoform expression and CD3/CD28. Post-hoc analyses determined the effect of PMCA expression relative to control in unstimulated (p > 0.05), and in cells plated on anti-CD3/CD28 antibodies (** p < 0.01; *** p < 0.001). (E to G) Fluorescence microscopy analysis of Jurkat T cells co-transfected with STIM1-mCherry (red) and either GFP-PMCA4b (green, E) or GFP-PMCA4a (green, F), and activated as indicated for 2 hours (scale bar = 5 μm). Images (E and F) are representative of >5 independent experiments. Co-localization between STIM1 and PMCA4 is shown in white. Pearson coefficients (G; means ± SEM; 19-63 cells) were calculated across the entire cell. ns, not significant by two-way ANOVA. (H and I) FRET by acceptor photobleaching analysis in Jurkat cells co-transfected with STIM1-mCherry and either GFP-PMCA4b (H) or GFP-PMCA4a (I). Means ± SEM of FRET values>0.1 (FRET+) regions for each cell are plotted on the y-axis, and the percentage of area in which FRET was detected out of the total area photobleached on the x-axis (%FRETpos Area). Data are from >5 independent experiments, n=7-10 cells per condition. (J and K) Fluorescence microscopy analysis of Ca2+ clearance in Fura-2 AM-loaded, thapsigargin-treated Jurkat T cells that were transfected with STIM1-mCherry and either GFP-PMCA4b (J) or GFP-PMCA4a (K), plated on CD3/CD28 antibody-coated coverslips, and exposed to Ca2+ for 2 min before recording in Ca2+-free buffer + EGTA. Resultant Ca2+ clearance (determined from 5-6 independent experiments) is shown as open circles. In addition, data was fit to a biphasic exponential decay model, shown as a line. Representative full-length traces of these experiments are presented in fig. S1; quantitation of Ca2+ clearance dynamics with statistical analysis is provided in table S1.

