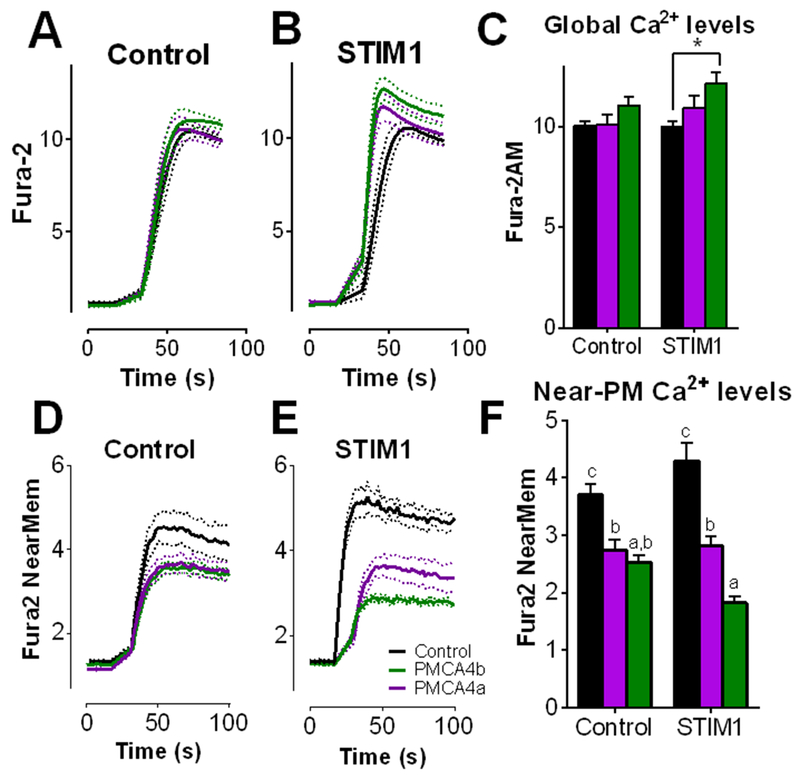
Figure 6: PMCA4b expression lowers near-membrane, but not global cytosolic Ca2+ levels.
Jurkat T cells were transfected with empty vector (control) or mCherry-STIM1 (STIM1) along with empty vector (black), GFP-PMCA4a (purple), or GFP-PMCA4b (green) and incubated for 24 hours before serum starving (3 hours) and plating on CD3/CD28 antibodies. Cells were loaded with Fura-2 AM to measure global cytosolic Ca2+ levels (A to C) or the near-PM Ca2+ indicator Fura-2 NearMem (D to F). ER Ca2+ was depleted with thapsigargin in the absence of extracellular Ca2+ prior to time 0; Ca2+ entry was measured upon the addition of 1 mM Ca2+. Traces shown are mean ± SEM from 3 independent experiments, each consisting of 40 to 60 cells. Entry was calculated as the maximum F340/F380 - minimum F340/F380 of each cell. *P<0.05 by two-way ANOVA followed by Tukey’s post-hoc test. In (F), statistically significant differences amongst each condition is indicated by a, b, c; p<0.05.

