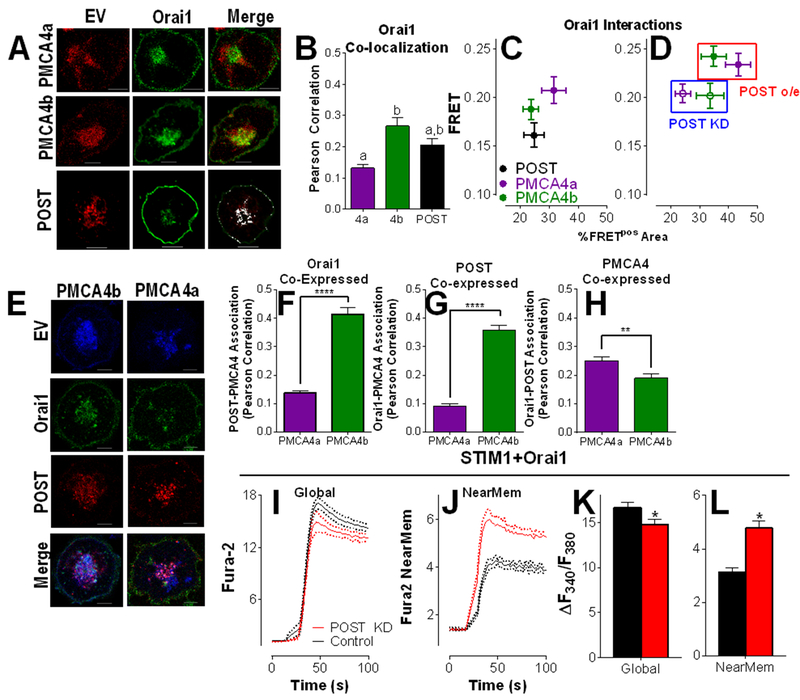
Figure 7: POST couples PMCA4-mediated Ca2+ clearance to Orai1-mediated Ca2+ entry.
(A) Representative images of Jurkat T cells co-transfected with CFP-Orai1, mCherry-POST, and either GFP-PMCA4b or GFP-PMCA4a, and serum starved before plating on anti-CD3/CD28 coated coverslips. Scale bar= 5 μM. (B) Co-localization between Orai1 and either PMCA4a, PMCA4b or POST was measured by Pearson correlation in cells described in (A); means ± SEM are plotted; n=12-21 cells per condition. Unpaired two-tailed T-tests determined statistical significance; ****P<0.0001. (C) FRET by acceptor photobleaching was performed in cells expressing Orai1 and each of POST, PMCA4b and PMCA4a and analyzed as previously described (Fig. 1I) (D) FRET experiments between Orai1 and PMCA4 described in panel C were repeated after co-expression with POST siRNA (POST KD) or mCherry-POST (POST o/e, average ± SEM are plotted. Data in panels C and D are average ± SEM, n=15-20 cells per condition. (E to H) Representative images (E) of activated Jurkat T cells co-transfected with Orai1-YFP (green) and mCherry-POST (red) along with either CFP-PMCA4a or CFP-PMCA4b (blue). Colocalization between POST and PMCA4 (F), Orai1 and PMCA4 (G), and Orai1 and POST (H) was quantified by Pearson correlation; n=29-31 cells per condition. Unpaired two-tailed T-tests determined statistical significance; ** P<0.01; **** P<0.0001. (I to L) Jurkat T cells were transfected with YFP-STIM1, CFP-Orai1 and either scrambled RNA or POST siRNA before a 24-hour incubation and serum starvation (3 hours). Cells were plated on CD3/CD28 antibodies and loaded with either Fura-2 AM to measure global cytosolic Ca2+ levels (I) or the near-PM Ca2+ indicator Fura-2 NearMem (J). Traces shown are mean ± SEM from 3 independent experiments, each consisting of 40 to 60 cells. (K and L) Ca2+ entry for each condition was analyzed by 2-way ANOVA; the difference between global and near-MEM Ca2+ entry was p<0.0001; the effect of POST was p>0.05; interdependence between POST expression and changes in Ca2+ entry was p=0.017. * indicates statistical differences due to POST overexpression (p < 0.05).

