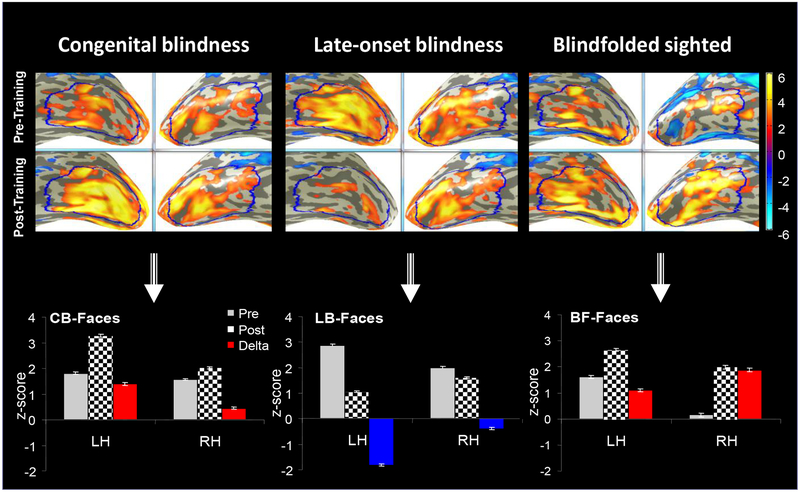
FIG. 3.
Average activation maps of the two groups of blindness (CB and LB) and of blindfolded (BF) in the LSOT area of the visual ventral pathway. LSOT region in the left (LH) and right (RH) hemispheres (blue) were defined to measure the large-scale effects. The grey bars represent the pre-training BOLD response bilaterally; the checkerboard bars - the post-training BOLD response. The training effect is measured by the difference between the post-training and pre-training responses. Increased training effects are shown by red bars, and reduced training effects are shown by blue bars. Note the opposite sign effect in the acquired, or late-onset, blindness. The training effect was stronger in the left hemispheres of the blind groups, but in the right hemisphere of the blindfolded-sighted.

