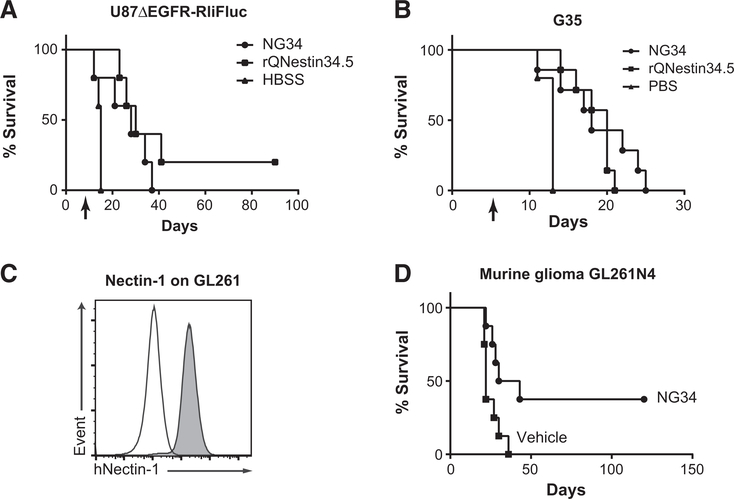
Figure 4.
Therapeutic efficacy of NG34 in vivo. A and B, Kaplan–Meier survival curves of athymic nude mice bearing intracerebral U87ΔEGFR-RliFluc (A) or G35 (B) GBMs after treatment with intratumoral oHSV (2 × 10⁵ PFU) or HBSS vehicle on day 7 (A) or day 5 (B) postimplantation (U87ΔEGFR-RliFluc, n = 5; G35, n = 7) denoted by the arrow. Statistical analysis of (A) by log-rank test, where P < 0.05 (A and B), HBSS versus NG34; P < 0.01 (A) and P < 0.001 (B), HBSS versus rQNestin34.5; P = 0.275 (A) and P = 0.392 (B), NG34 versus rQNestin34.5. Tumor growth of U87ΔEGFR-RliFluc was also monitored by in vivo bioluminescence imaging as shown in Supplementary Fig. S4. C, Histograms showing the levels of human Nectin-1 expression (y-axis) on GL261 (white) and GL261N4 (gray) cells by FACS analysis using anti-human Nectin-1/CD111 antibody. D, Kaplan–Meier survival curves of C57Bl/6 mice bearing intracerebral murine GL261N4 glioma after treatment with intratumoral NG34 (1 × 10⁶ PFU) or HBSS vehicle on day 7. Statistical analysis (n = 8, each) by log-rank test, where P < 0.05.

