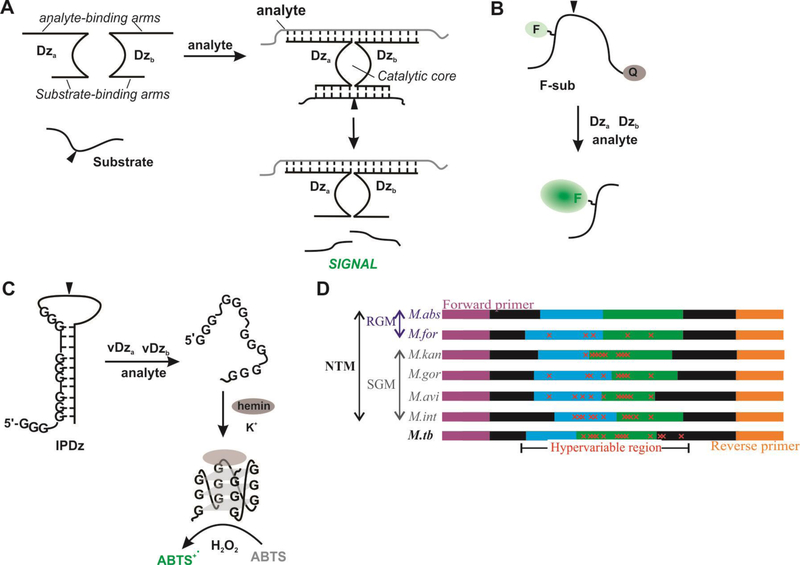
Figure 1. Schematic representation of the BiDz assay design.
A. In the presence a fully complimentary analyte, sensors assemble to reform the deoxyribozyme catalytic core, which cleaves the substrate (at site denoted by black triangle) to generate a fluorescent (B) or colorimetric (C) signal. D). Schematic diagram of 16S rRNA PCR amplicon containing hypervariable regions used for differentiation of 6 NTM species (M.abs, M.for, M.kan, M.gor, M.avi, M.int) and M.tb. Sequences are colored to indicate role in assay design: purple (forward primer), blue (Dza), green (Dzb), and orange (reverse primer). The red “x” indicates mutations contained in the hypervariable region.

