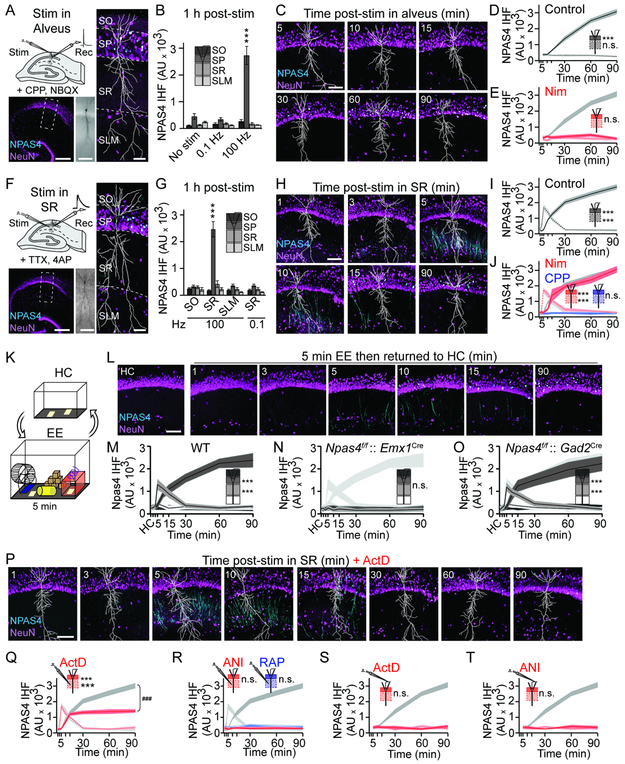
Figure 1. Distinct excitation pathways induce NPAS4 expression in CA1.
A, Schematic of stimulation in alveus. Hippocampal slice (bottom left) immunostained for NPAS4 (cyan) and NeuN (magenta). Dashed inset shown at right. Biocytin fill (middle) and reconstruction (white, right) is shown.
B, Quantification of NPAS4 IHF in each layer post-stimulation in alveus.
C, CA1 from slices fixed at the indicated times.
D, Quantification of NPAS4 IHF in SR and SP.
E, As in (D) but with Nim. Data from (D) are replotted in gray.
F, Schematic stimulation in SR (top left). Immunostaining as in (A).
G, As in (B) but post-stimulation in SR, SO, or SLM.
H–J, As in (C–E) but post-stimulation in SR. For (J), Nim or CPP in the bath. Data from (I) are replotted in gray.
K, Schematic of EE.
L, CA1 at the indicated times post-EE.
M, Quantification of NPAS4 IHF in CA1 from WT mice at the indicated.
N and O, as in (M) but from Npas4f/f mice crossed to Emx1Cre (N) or Gad2Cre (O) mice.
P, As in (H) but with ActD.
Q and R, As in (I) but with ActD (Q) and ANI or RAP (R). Data from (I) are replotted in gray. SP, 90 min, ActD vs control: ###p<0.001.
S and T, as in (D) but with ActD (S) or ANI (T). Data from (D) are replotted in gray.
Scale bars: (A, F) 300 μm (bottom left), 100 μm (middle), 50 μm (right), and (C, H, L, P) =100 μm. *p<0.05, **p<0.01, ***p<0.001, n.s., not significant. N and statistical tests indexed in Table S1. See also Figures S1 and S2.

