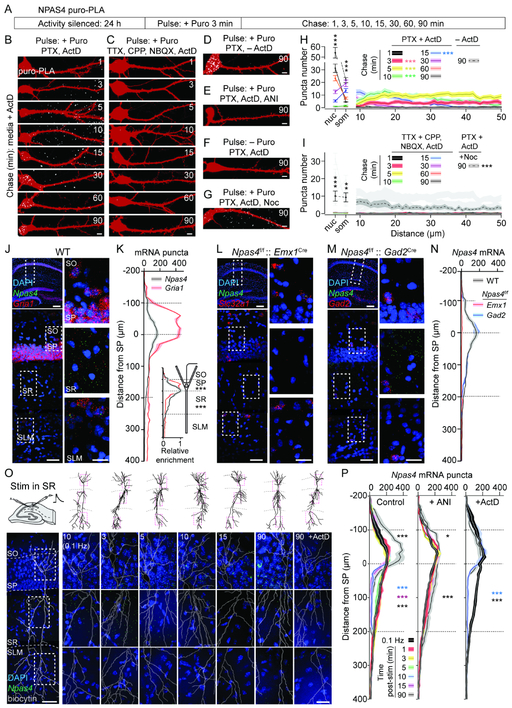
Figure 2. EPSP-induced NPAS4 is translated in dendrites and trafficked to the soma.
A, Schematic of NPAS4 puro-PLA metabolic labeling.
B–G, Neurons pulsed then chased for the indicated durations. Newly-synthesized NPAS4 (white) and RFP (red) are shown. Pharmacology as indicated.
H–I, Quantification of puro-PLA puncta in the nucleus (nuc), soma (som), and dendrites of neurons. Pharmacology as indicated. Data from (H) replotted in gray (I).
J, smFISH for Npas4 and Gria1 mRNAs in hippocampus of WT mice (top left). Dashed inset in CA1 is shown (bottom left and expanded (right).
K, Quantification of mRNA puncta along somato-dendritic axis of CA1. Superficial edge of SP=0 μm. Inset: mRNA normalized to peak in SP.
L and M, As in (J) but from Npas4f/f::Emx1Cre (L) and Npas4f/f:: Gad2Cre (M) mice and probed with Npas4 and Slc32a1 or Gad2.
N, As in (K), in WT, Npas4f/f:: Emx1Cre, and Npas4::f/f::Gad2Cre tissue.
O, Schematic of stimulation in SR (top left). Images of CA1 probed for Npas4 at indicated times post-stimulation in SR (bottom). Biocytin reconstructions are shown. Dashed insets (top; red) are shown (bottom).
P, Quantification of Npas4 puncta at indicated times post-stimulation in SR. Control conditions (left), ANI (middle) or ActD (right) are shown. * denotes significance relative to low frequency stimulation in that layer.
Scale bars: (B–G) 5 μm, (J, L, M) 300 μm (top left), (J, L, M, O) 50 μm (bottom left), 20 μm (insets). *p<0.05, **p<0.01, ***p<0.001. N and statistical tests indexed in Table S1. See also Figure S3.

