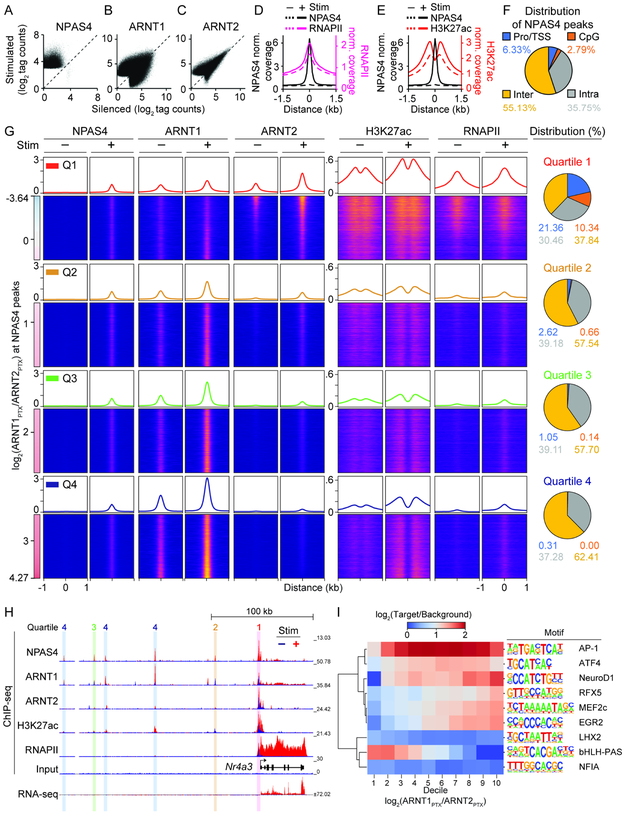
Figure 6. NPAS4 heterodimers exhibit different patterns of DNA binding.
A, Scatter plot of NPAS4 peaks in stimulated (PTX, 2 h) vs silenced (TTX, NBQX, CPP; 24 h) neurons.
B and C, As in (A) but for ARNT1 (B) or ARNT2 (C).
D and E, Aggregate plot of NPAS4 and RNAPII (D) or H3K27ac (E) peaks as a function of distance from NPAS4 peak center in silenced and stimulated neurons.
F, Distribution of NPAS4 peaks at promoters/TSS, CpG-rich, intra-, and intergenic sites.
G, NPAS4, ARNT1, ARNT2, H3K27ac, RNAPII peaks sorted along the continuum of ARNT1 and ARNT2 co-binding in stimulated neurons (log2(ARNT1PTX/ARNT2PTX)). Quartiles (Q1–4) span from highest co-bound ARNT2 (top; Q1) to highest co-bound ARNT1 (bottom; Q4). Aggregate plots of normalized coverage are shown above heat maps. Distribution of NPAS4 peaks at the indicated genomic loci is shown (right).
H, Example tracks for ChIP- and RNA-seq data at the Nr4a3 locus in silenced (−; blue) and stimulated (+; red) neurons. Vertical bars over peaks denote assigned quartile.
I, Dendrogram and heatmap of motif enrichment of top-ranked de novo motifs across deciles of the ARNT1:ARNT2 tag count ratio at NPAS4 peaks in stimulated cells.

