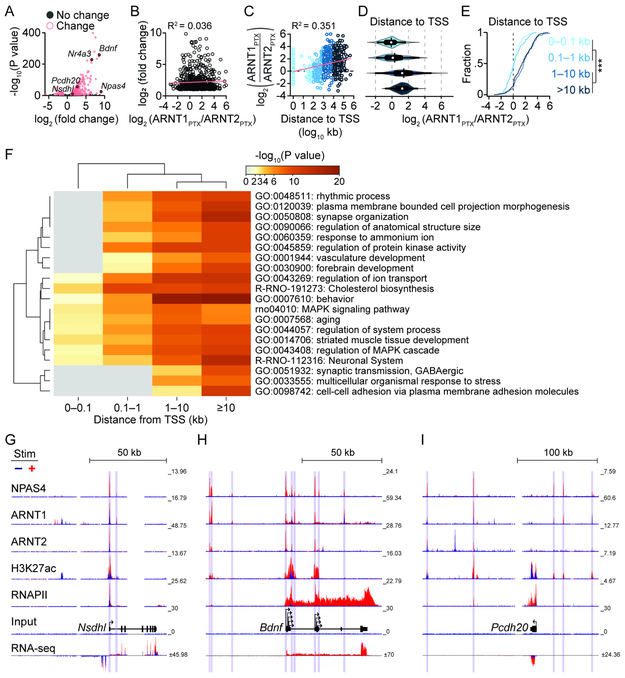
Figure 7. NPAS4 heterodimers are recruited to distinct regions of activity-upregulated genes.
A, Volcano plot of change in gene expression between silenced and stimulated neurons. Activity-regulated genes (pink): fold change ≥2 and −log10(P value)>5.
B, Scatter plot of upregulated genes vs. log2(ARNT1PTX/ARNT2PTX) from the NPAS4 peak nearest the TSS of the activity-regulated gene.
C, Scatter plot depicting log2(ARNT1PTX/ARNT2PTX) vs. distance of NPAS4 to TSS of an activity-induced gene.
D, Violin plot of log2(ARNT1PTX/ARNT2PTX) values at NPAS4 peaks assigned to the nearest activity-upregulated gene and binned by distance. Mean: vertical bar, median: white circle, SEM: thick horizontal bar, SD: thin horizontal bar, and distribution: colored contour.
E, Cumulative fraction of log2 (ARNT1PTX/ARNT2PTX) values at NPAS4 peaks assigned to the nearest activity-upregulated gene and binned by distance from TSS. ***p<0.0001.
F, Metascape heatmap and dendrogram of GO term enrichment among upregulated genes with NPAS4 peaks at increasing distance from TSS.
G–I, Example ChIP- and RNA-seq tracks at genes with NPAS4 peaks at the TSS (Nsdhl, G), TSS and distal sites (Bdnf, H) and distal only sites (Pcdh20, I). Vertical bars denote called peaks.
(B, C) Linear regression (pink) and R2 values. See also Table S6.

