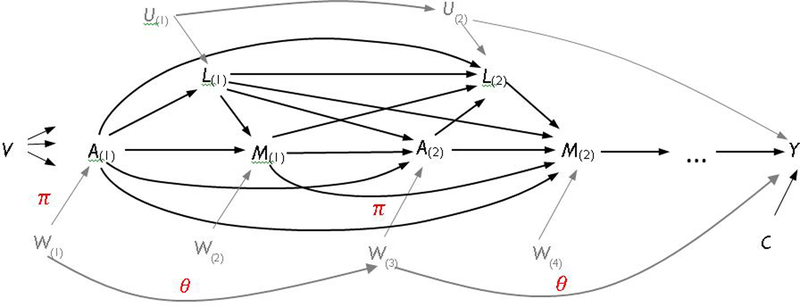
Fig. A1.
A Hypothetical Causal Framework of Multigenerational Social Mobility with Unmeasured Time-Varying Variables
Notes: A(1) = G1’s educational attainment, M(1) = family structure in G1 during G2’ childhood, L(1) = socioeconomic characteristics, such as family income, occupational status, home ownership, and disability status in G1 during G2’ childhood, A(2) = G2’ education, M(2) = family structure in G2 during G3’s childhood, U, W = unmeasured variables, Y = G3’s educational attainment. C = exogenous variables that influence Y, such as gender and age group. V = family invariant variables, such as race. Relationships among variables are encoded in the directed acyclic graph (DAG) above. For the sake of simplicity, the graph omits all the arrows pointing from A(t), L(t), M(t), and W(t) to Y. While not explicitly shown in the graph, the strength of grandparent’s direct effect, i.e., the arrow pointing from A(1) to Y, may vary by the values of M(1) and M(2) according to the research hypothesis of this study. Unlike Figure 1, this graph assumes that the errors of W(t) are correlated with each other as well as with Y. The correlations of these standarized variables are represented by and .

