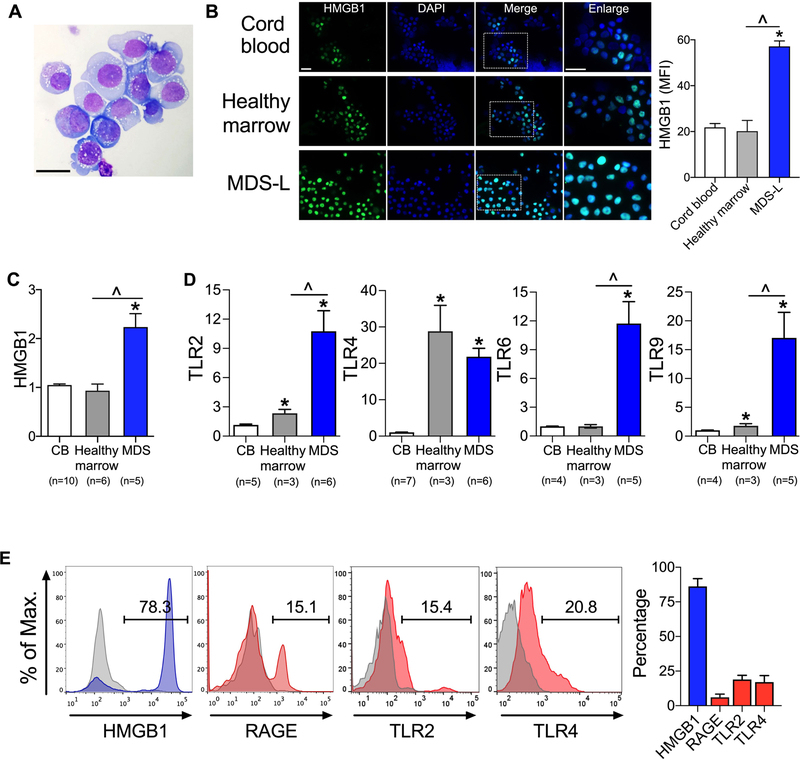
Figure 1. HMGB1 is overexpressed in MDS.
(A) Wright stain of MDS-L cells. Scale bar 50 µm. (B) Staining of HMGB1 (green), 4’,6-diamidino-2-phenylindole (DAPI, blue) and merged images in CD34+ cord blood, CD34+ healthy marrow, and MDS-L cells. Boxed areas correspond to enlarged images. Scale bars 20 µm. Right, quantification of mean fluorescence intensity (MFI) of HMGB1. n= 10–11/group. *P <0.0001 for MDS compared to cord blood; ^P <0.0001 for MDS compared to healthy marrow. (C) HMGB1 mRNA expression from CD34+ CB, CD34+ healthy marrow, and primary MDS without treatment indicated in Table S1 (i.e. DP0246, 0405, 0448, 0449, 0460). Number of biologic samples (n) is as noted with 3 technical replicates/sample. *P <0.0001 for MDS compared to cord blood; ^P <0.0001 for MDS compared to healthy marrow. (D) mRNA expression of TLRs in CD34+ CB, CD34+ healthy marrow and primary MDS without treatment. Number of biologic samples (n) is as noted with 3 technical replicates/sample. *P ≤0.02 for cord blood compared to healthy marrow or MDS; ^P ≤0.02 for healthy marrow compared to MDS. (E) Flow cytometric analysis of HMGB1 and its receptors in CD34+ primary MDS. n= 13, 5, 3 and 3 biologic samples for HMGB1, RAGE, TLR2 and TLR4 respectively. Student’s 2-tailed, unpaired t tests were used in these analyses.

