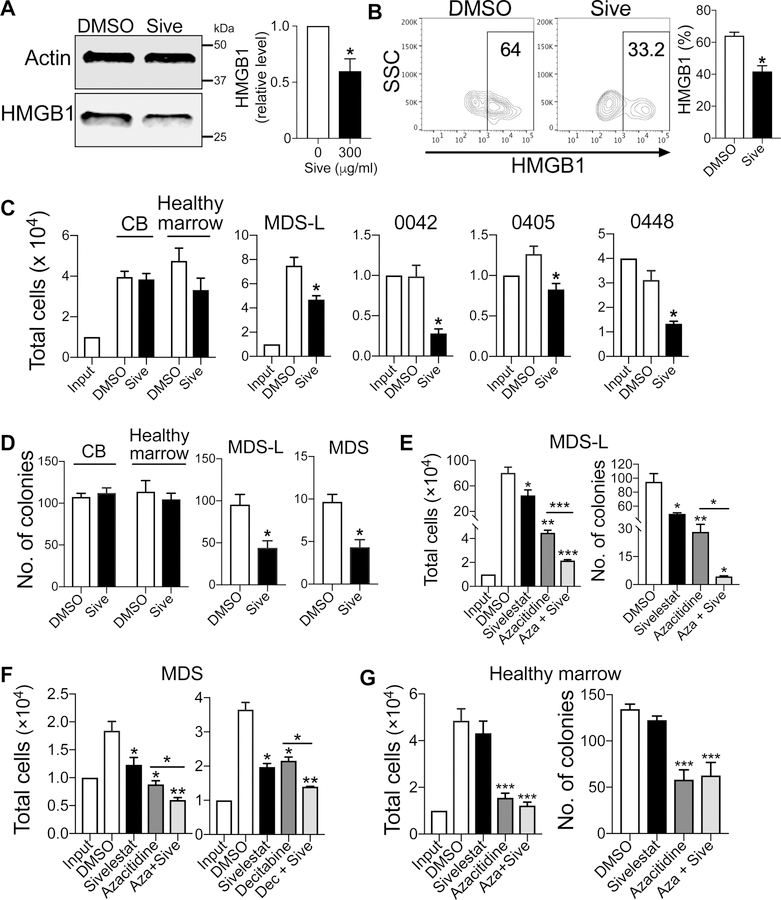
Figure 2. Inhibition of HMGB1 with sivelestat is additive to chemotherapy to abrogate MDS cell expansion.
(A) Western blot and quantification of HMGB1 protein expression in MDS-L cells at 72 h after 300 µg/ml sivelestat. * P< 0.02. n= 3/group. (B) Representative flow cytometry plots of HMGB1 in CD34+ MDS cells following 72 h culture either with 300 µg/ml sivelestat or DMSO. SSC, side scatter. Right, quantification of HMGB1. n= 4 biologic samples, *P= 0.02 for Sive compared to DMSO. (C) Total cells of CD34+ cord blood (CB), CD34+ healthy marrow, MDS-L, and primary CD34+ MDS marrow (i.e., 0042, 0405, 0448) after 72 h culture with 300 µg/ml sivelestat or DMSO. *P< 0.01. n= 3–9/group. (D) CFCs from 72 h cultures with 300 µg/ml sivelestat or DMSO. Number of cells from culture per dish: 1,000 cells for CB, healthy marrow, and MDS-L cells, 2,500 cells for primary MDS cells. *P< 0.01. n= 3–6/group. (E) MDS-L cells were cultured with 300 µg/ml sivelestat, 10 µM azacitidine (Aza), or 10 µM azacitidine + 300 µg/ml sivelestat (Aza + Sive) for 7 d. Total cells and CFCs at 7 days. n= 3–6/group. (F) Cell expansion in primary CD34+ MDS cells after culture with chemotherapy alone or chemotherapy + sivelestat. Left, primary CD34+ MDS cells were treated with 300 µg/ml sivelestat, 10 µM azacitidine (Aza), or 10 µM azacitidine + 300 µg/ml sivelestat (Aza + Sive) for 3 d. Right, primary CD34+ MDS cells were treated with 300 µg/ml sivelestat, 75 nM Decitabine, or 75 nM Decitabine and 300 µg/ml sivelestat (Dec + Sive). n= 3/group. (G) Total cells and CFCs of CD34+ healthy marrow cells at 72 h following incubation with 300 µg/ml sivelestat, 10 µM azacitidine (Aza), or 10 µM azacitidine + 300 µg/ml sivelestat (Aza + Sive). n= 3 biologic replicates with 9–12 technical replicates/group. For E-G, *P< 0.05, **P< 0.001, ***P< 0.0001 for sivelestat, chemotherapy, and chemotherapy + Sive compared to DMSO or for chemotherapy compared to chemotherapy + Sive. Student’s 2-tailed, unpaired t tests were used in these analyses.

