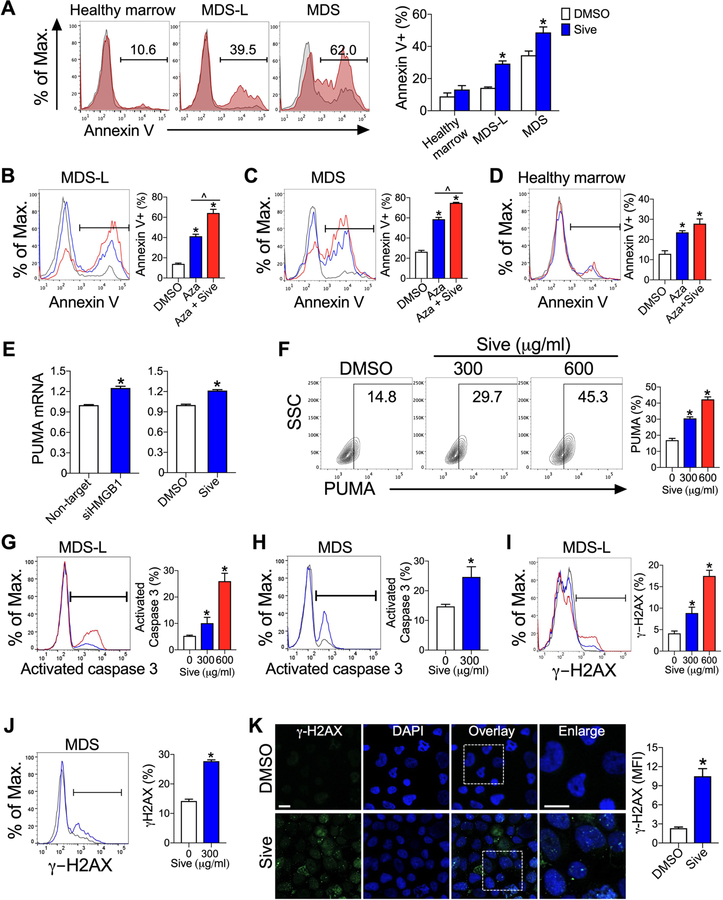
Figure 5. Inhibition of HMGB1 promotes cellular apoptosis via upregulation of PUMA, activation of caspase 3, and induction of DNA breaks.
(A) Annexin V+ cells at 72 h after culture with 300 µg/ml sivelestat (red) or DMSO (gray). *P < 0.0001 for MDS-L; *P= 0.01 for primary MDS cells. n= 9–11/group. (B-D) Annexin V+ cells from cultures of (B) MDS-L cells, (C) primary MDS cells, or (D) healthy marrow cells with DMSO (gray), 10 µM azacitidine (Aza, blue), or 10 µM azacitidine and 300 µg/ml sivelestat (Aza + Sive, red) at day 7. *P < 0.0001 for Aza and Aza + Sive compared to DMSO, ^P ≤ 0.001 for Aza compared to Aza + Sive. n= 4/group for MDS-L and primary MDS cells. n= 8/group for healthy marrow. (E) PUMA mRNA expression in MDS-L cells following HMGB1-specific siRNA for 72 h or 300 µg/ml sivelestat for 8 h compared to control cultures. *P<0.0001 and n= 6/group for siRNA. *P= 0.0003 and n= 3/group for sivelestat. (F) Flow cytometric analysis of PUMA at 24 h in MDS-L cells treated with sivelestat or DMSO. *P < 0.001, *P= 0.0002 for 300 µg/ml and 600 µg/ml sivelestat compared to DMSO, respectively. n= 3/group. SSC, side scatter. Flow cytometric analysis of activated caspase 3 at 24 h in MDS-L cells (G) or primary CD34+ MDS (H) with DMSO (gray), 300 µg/ml (blue) or 600 µg/ml sivelestat (red). *P< 0.04, *P< 0.0001 for DMSO compared to 300 µg/ml and 600 µg/ml sivelestat, respectively. n= 6/group for MDS-L cells. P< 0.05 for DMSO compared to sivelestat. n= 3/group for primary CD34+ MDS. Flow cytometric analysis of γ-H2AX in MDS-L cells (I) and CD34+ MDS cells (J) treated with DMSO (gray), 300 µg/ml (blue) or 600 µg/ml sivelestat (red) for 24h. For MDS-L, n= 10/group. *P< 0.005 and < 0.0001 for DMSO compared to 300 µg/ml and 600 µg/ml sivelestat, respectively. For primary CD34+ MDS, n= 4/group. *P< 0.0001 for DMSO compared to sivelestat. (K) γ-H2AX (green) and DAPI (blue) staining of MDS-L cells in culture for 24 h. Scale bar 10 µm. *P= 0.001. n= 4/group.

