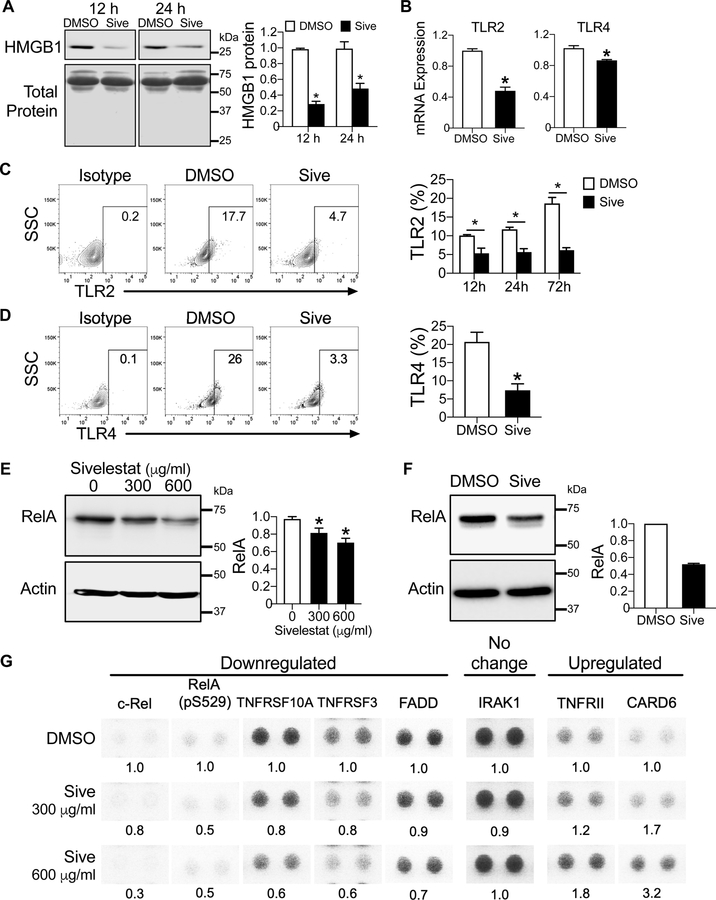
Figure 6. Sivelestat modulates the innate immune response in MDS via the NFκB pathway.
(A) Left, HMGB1 protein expression by Western analysis of conditioned media from MDS-L cells in 12 h- or 24 h-culture with 300 µg/ml sivelestat or DMSO. Total protein as a loading control is visualized by Ponceau S staining. Right, quantification of HMGB1 protein in conditioned media for specified culture conditions. *P <0.0001 and = 0.01 for 12 h and 24 h, respectively. n= 3/group. (B) mRNA expression of TLR2 and TLR4 in MDS-L cells following culture with DMSO or 300 µg/ml sivelestat for 4 h. *P = 0.0007 and 0.005 TLR2 and TLR4, respectively. n= 3–4/group. (C) Left, Representative flow cytometry plots of isotype and TLR2 in CD34+ primary MDS at 72 h with DMSO or 300 µg/ml sivelestat. Right, Quantification of flow cytometric analysis at 12h, 24h and 72h from (C). *P = 0.01, 0.001, 0.0001 for 12h, 24h and 72h, respectively. n= 4–5/group. (D) Left, Representative flow cytometry plots of isotype and TLR4 in CD34+ primary MDS at 24 h. Right, Quantification of flow cytometric analysis at 24h from (D). *P = 0.007. n= 3–4/group. Student’s 2-tailed, unpaired t tests were used in these analyses. (E, F) Western blot of RelA following 24 h culture with sivelestat compared to DMSO in MDS-L (E) and in CD34+ MDS (F). Quantification of RelA level normalized to actin, a loading control for each sample. *P =0.03 and =0.0008 for 300 µg/ml and 600 µg/ml sivelestat vs. DMSO, respectively. n=6 from three independent studies for MDS-L. n= 1 biologic sample for CD34+ MDS; 2 technical replicates/group. (G) MDS-L cells were treated with DMSO or sivelestat (300 and 600 µg/ml) for 24 h. Cell lysates were applied to Proteome Profiler NFκB Array. Each target was assayed in duplicate. Shown are select protein targets that have been cropped from images shown in Fig. S6. Levels of proteins were analyzed compared to DMSO for each target. Abbreviations: CARD6, caspase recruitment domain 6; FADD, Fas-associated protein with death domain; IRAK1, Interleukin-1 receptor-associated kinase 1; TNFRSF3, Tumor Necrosis Factor Receptor SF3; TNFRSF10A, Tumor Necrosis Factor Receptor SF10A. Student’s 2-tailed, unpaired t tests were used in these analyses.

