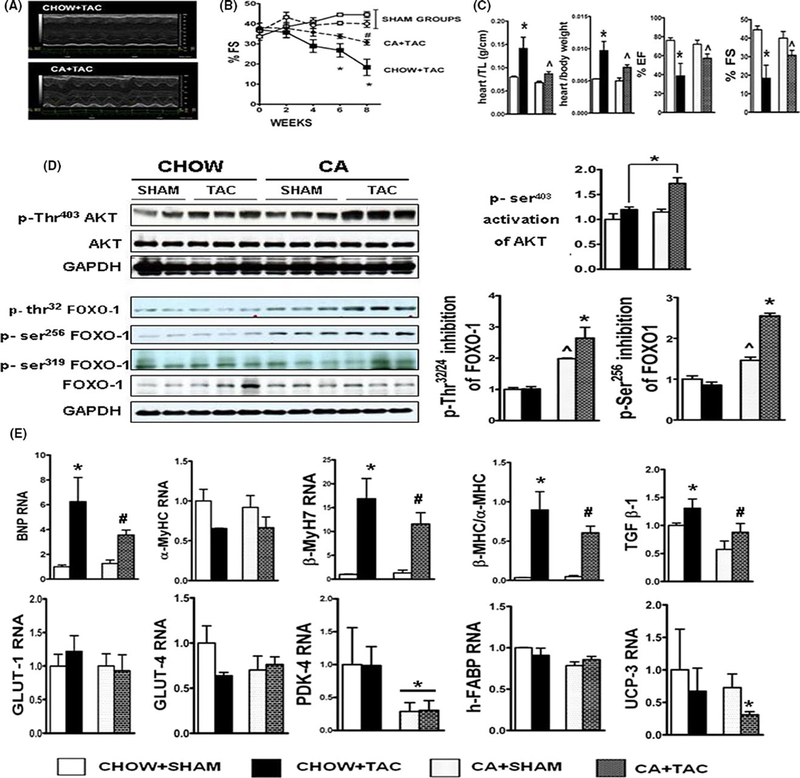
FIGURE 3.
CA attenuates transverse aortic constriction (TAC) induced hypertrophy and contractile failure: (A) shows M-Mode 2DE images of chow fed and CA fed hearts post- TAC. Note attenuation in contractile dysfunction in CA fed post- TAC hearts. (B) shows serial shortening fractions (%FS) of C57BL6 mice either fed CHOW or 0.5% cholic acid (CA) supplemented chow, when challenged with TAC or SHAM. Note significant attenuation of %FS in CA fed TAC (CA + TAC) mice compared to CHOW+ TAC mice. (n = 5– 10/grp; Stats: Multiple comparison ANOVA; *P < 0.05 compared to all groups; # P < 0.05 vs SHAM, Results: Mean ± SEM). (C) denotes quantification of heart weights indexed to body weight and tibial length at end of 8 wk. Note attenuation in TAC induced pathologic hypertrophy of hearts in CA fed mice (n = 5/sham groups, 10/TAC group); Stats: ANOVA with Tukey’s post hoc comparison between groups; *P < 0.05 when CHOW + TAC was compared to all groups; ^P < 0.05 when CA + TAC is compared to SHAM groups and CHOW + TAC group. vs SHAM, Results: Mean ± SEM). (D) shows images of Ser 473 phospho- AKT, total AKT, Thr32, Ser 256 and Ser 319 phospho-FOXO-1 and total FOXO-1. Activation (phosphorylation) of AKT, and inhibition (phosphorylation) of FOXO-1 was evaluated by dividing the phosphorylated to unphosphorylated forms of AKT and FOXO- 1, respectively. GAPDH blot is depicted to show equal loading. CA+TAC mice show enhanced activation of AKT and increased inhibition of FOXO-1 than CHOW+TAC mice. Also note significantly increased inhibition of FOXO-1 in the CA + SHAM mice, compared to CHOW+SHAM.(Results: Mean ± SEM; *P < 0.05 when CA + TAC was compared to all groups; ^P < 0.05 when CA+SHAM is compared to all groups, Stats: ANOVA with Tukey’s post hoc). (E) denotes BNP, βMYH7 RNA along with βMHC:αMHC ratio as measured by QRTPCR, in the 4 experimental groups. RNA has been standardized to 18S subunit and expressed as fold change compared to CHOW fed SHAM mice. Note attenuation of BNP, βMYH7 and βMHC:αMHC ratio at RNA level in the CA + TAC group (#P < 0.05 comparing CA+TAC with CHOW+TAC and SHAM groups; *P < 0.05 compared to all groups). Also note downregulation of PDK4 (*P < 0.05 when CA fed groups are compared to CHOW fed groups), and downregulation of UCP3 (*P < 0.05 when CA+TAC is compared to rest of the groups) (n = 5 per group; Results: Mean ± SD; Stats: ANOVA with Tukey’s post hoc)

