Figure 1.
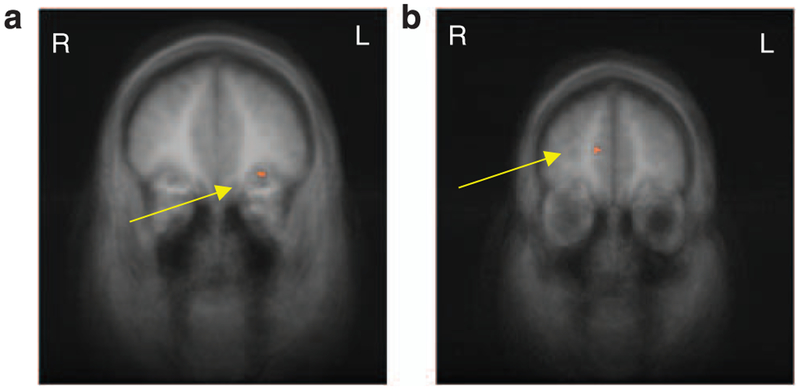
(a) fMRI results from the between-group food vs non-food contrasts, co-registered with average structural MRI data from the participants. The maps are presented in the coronal perspective. The significance thresholds for display are set at P<0.001, uncorrected. The arrow highlights greater activation in the left OFC in the obese group than the HW group in the post-meal condition (x = −30, y = 35, z = −8; t = 3.92). (b) fMRI results from the direct group comparison (obese, HW) of the condition (pre-meal, post-meal) and stimulus type (food, control) co-registered with average structural MRI data from the participants. The maps are presented in the coronal perspective. The significance thresholds for display are set at P<0.001, uncorrected. The arrow highlights greater reduction of activation in the medial PFC for HW vs obese groups (x = 12, y = 47, z = 16; t = 4.64). fMRI, functional MRI; HW, healthy wright; OFC, orbitofrontal cortex; PFC, prefrontal cortex.

