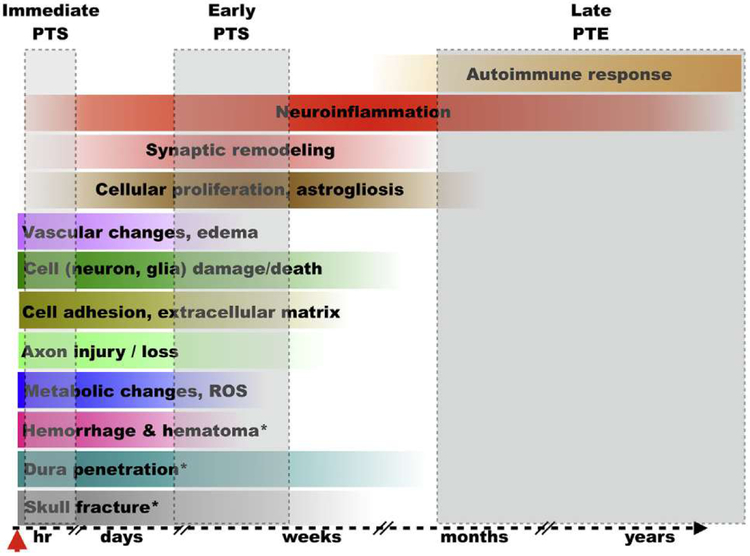
Fig. 1.
The onset and extent of select pathological changes and biological responses after TBI (a hypothetical model). The colored horizontal bars illustrate the approximate onset and scale of the individual pathological changes following injury; color gradients reflect time-dependent changes in the intensity of individual pathobiologies. The grey shaded boxes indicate the relative onset of post-traumatic seizures (PTS) and post-traumatic epilepsy (PTE). * pathological changes that occur predominantly or exclusively after penetrating TBI; hr = hours; ROS = reactive oxygen species.

