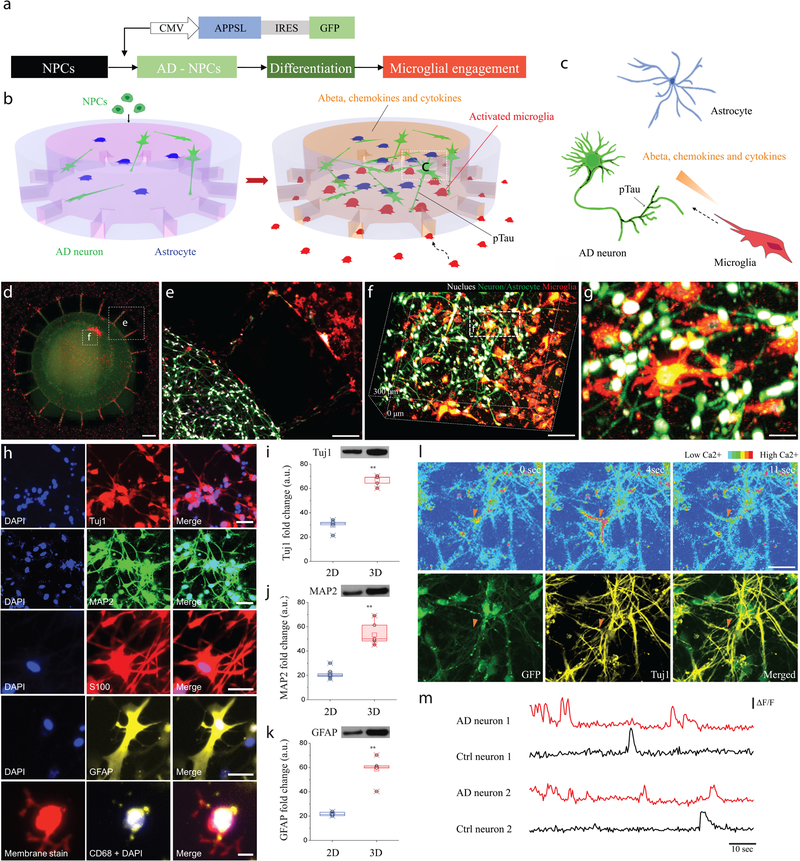
Figure 1. Construction of a 3D organotypic human AD culture model (3D NeuroGliAD: 3D Neu+AC+MG AD): a tri-culturing system of AD neurons, astrocytes differentiated from human neural progenitor cells (hNPCs), and human adult microglia in a 3D microfluidic platform.
(a) Schematic of differentiation of NPCs to AD Neuron/astrocyte and microglial engagement. Schematics describe multicellular 3D layouts in (b) a microfluidic human AD culture model and (c) a human AD brain tissue. (d) Fluorescent Microphotographs show the layout of human AD neuron+astrocyte (green) in a central chamber (CC) and microglia (red) in an angular chamber (AC). (e) Microglia are recruited across micro-channels between the CC and the AC by soluble factors from the AD culture cells. (f-g) Representative confocal microphotographs in the CC highlight the physiological 3D cellular engagement of neurons (green), astrocyte (green), and microglia (red) with nuclear staining (white). (h) Immunofluorescent microphotographs validate the differentiated neurons (blue: nucleus) with class III beta-tubulin Tuj1 (red) and MAP2 (green), astrocytes (blue: nucleus) with S100 (red) and GFAP (yellow), and the recruited microglia (blue: nucleus, red: pre-stained membrane) with CD68 (yellow). (i-k) Western blots assay demonstrates the increased expression of neuronal (Tuj1; left; df: t=9.105, df=5.24, R squared = 0.9405, F = 41.68, p=0.0009, ndevice= 20 from 3 week 1:1 thick culture condition; MAP2; middle; df: t=25.64, df=7.526, R squared = 0.9887, F = 1.67, p=0.0027, ndevice= 20 from 3 week 1:1 thick culture condition) and astrocyte markers (GFAP; right; df: t=12.58, df=7.828, R squared = 0.9529, F = 1.349, p=0.0019, ndevice= 20 from 3 week 1:1 thick culture condition) of the 3D culture system compared to a 2D culture after 3-week of differentiation. Data are normalized to undifferentiated hNPCs. All experiments were repeated ≥ 3 times. (l) Time-lapse microphotographs show calcium signaling with Cal590 fluorescent dyes from firing neurons (top, red triangle) and are compared with immunostained neuronal marker of Tuj1 in yellow and membrane in green (bottom). (m) Normalized values (ΔF/F) from neurons representative for control and the AD model after 3-week of differentiation indicate functionally connected neuronal activities All experiments were repeated ≥3 times: unpaired, two-sided Student’s t-test; **P < 0.01; All parameters are presented as the mean ± SEM. Scale bars: 250 μm in (d, e), 100 μm in (f), 40 μm in (g), 40 μm for Tuj1 and MAP2, 20 μm for S100, GFAP and CD68 in (h), 50 μm in (l), respectively.

