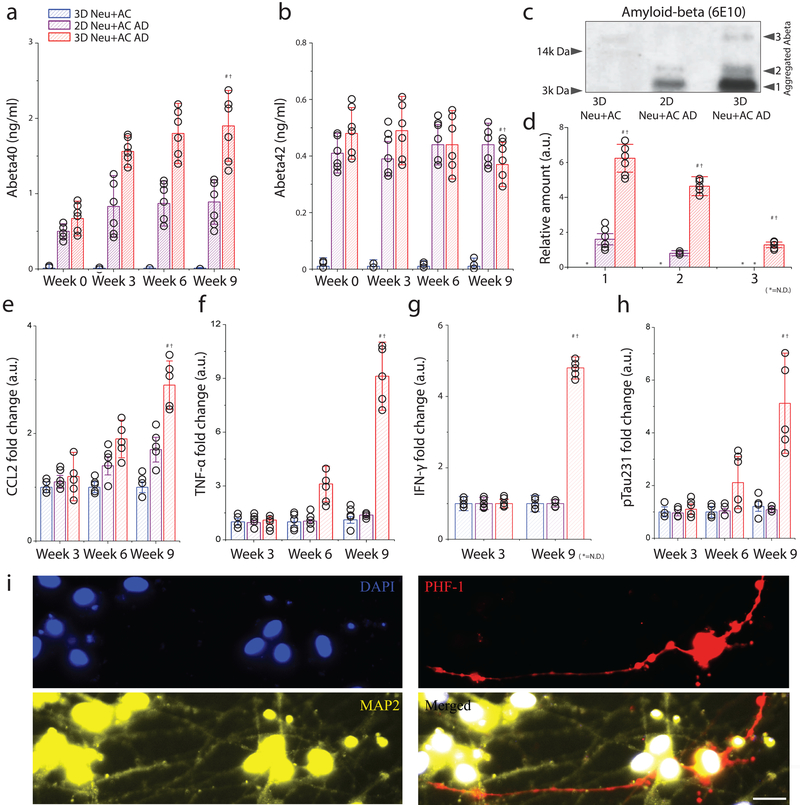
Figure 2. Recapitulation of pathological AD signatures: amyloid beta, phosphorylated tau, and IFN-γ in the 3D human AD neuron model (3D Neu+AC AD).
(a) Soluble Aβ 40 and (b) Aβ 42 were measured after 0-, 3-, 6-, and 9-week of differentiation in a 3D control (3D Neu+AC; blue), a 2D AD model (2D Neu+AC AD; purple), and a 3D AD model (3D Neu+AC AD; red), respectively. ndevice= 6 from 3 week 1:1 thick culture condition (c) Western blot analysis confirms the presence of SDS-resistant Aβ multimeric forms in 3D Neu+AC AD. All experiments were repeated ≥3 times (d) Quantification of elevated levels of multiple forms shown in Fig. 3c (F(DFn,DFd) = F(2,9) = 530.6, SS= 6.438). Noticeable increases of (e) CCL2 (R square =0.9804, F (2, 12) = 300.6), (f) TNF-α were observed in the 3D Neu+AC AD model (R square=0.9953, F (2, 12) = 1271). (g) IFN-γ (R square=0.7584, F (2, 12) = 18.84), (h) soluble p-tau (pSer231 tau, R square=0.9235, F (2, 12) = 72.39), and (i) p-tau accumulation (PHF-1; red) in neuronal cell body and neurites (green) were observed only after 9 weeks in the 3D Neu+AC AD model. All experiments were repeated ≥3 times: One-way ANOVA with Tukey–Kramer test; Statistical significance is denoted by # 3D Neu+AC week9 vs 3D Neu+AC ADweek9, † 2D Neu+AC+MG ADweek9 vs 3D Neu+AC+MG ADweek9, P < 0.001 with numberdevice = 5 in (a-h). Scale bar: 25 μm in (i).

