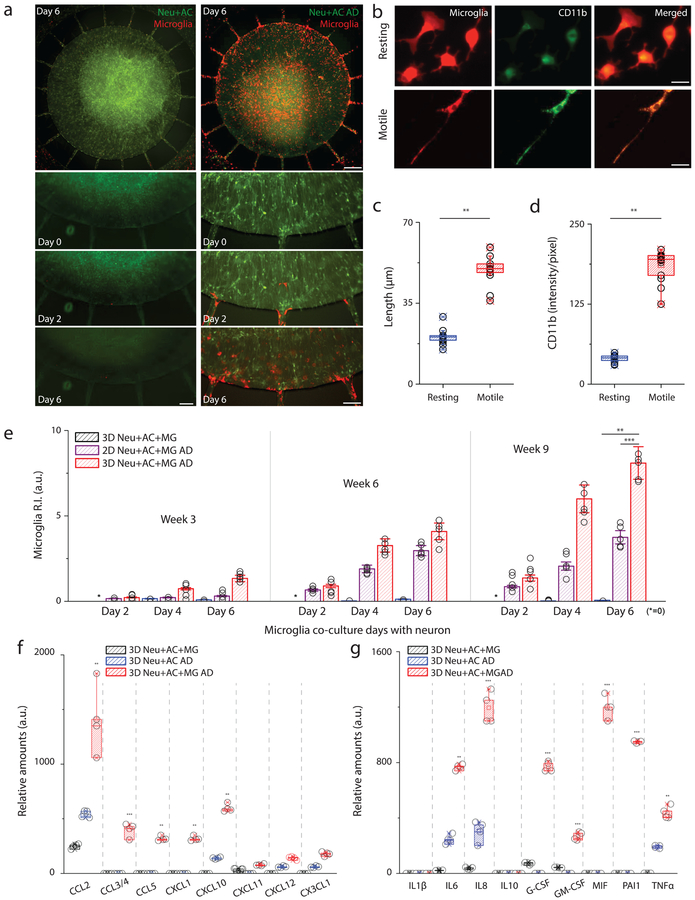
Figure 3. Activation of microglial inflammation: morphogenesis, marker expression, recruitment and inflammatory mediator release.
(a) Time-lapse microphotographs show microglial (red) recruitment by AD neuron+astrocyte (Neu+AC AD, green) compare to a control (Neu+AC, green). (b) Microglia are ramified (resting) on day 0 in the annular chamber (AC), become elongated (motile) on day 2, and migrate along the micro-channels toward the central chamber (CC). All experiments were repeated ≥3 times. Both the (c) length and (d) level of CD11b expression increase in the motile microglia (F (1, 14) = 564.7), All experiments were repeated ≥3 times: unpaired, two-sided Student’s t-test, ncells= 10 at Day4 culture condition. (e) Tri-culture in the 3D AD model (red, 3D Neu+AC+MG AD) leads to a dramatic increase in microglia recruitment as measured by the total number of microglia accumulated in the CC compared to the 3D control (blue, 3D Neu+AC+MG) and the 2D AD model (purple, 2D Neu+AC+MG AD) (R-square=0.9745, F (2, 12) = 228.9), All experiments were repeated ≥3 times: unpaired, Two-way ANOVA tests, ndevice= 5 at each culture condition. The 3D Neu+AC+MG AD also produced discernable amounts of (f) chemokines and (g) pro-inflammatory soluble factors (F (7, 21) = 115.6). All experiments were repeated ≥3 times, Two-way ANOVA tests, ndevice= 4 at each culture condition; Statistical significance is denoted by **P < 0.001, ***P < 0.0001 with numberdevice = 5 in (a), numbercell = 100 in (b, c, d), numberdevice = 5 in (e, f, g), respectively. n.s. stands for non-significant. All parameters are presented as the mean ± SEM. Scale bars: 25 μm (left) and 200 μm (right) in (a), 10 μm in (b), respectively.

