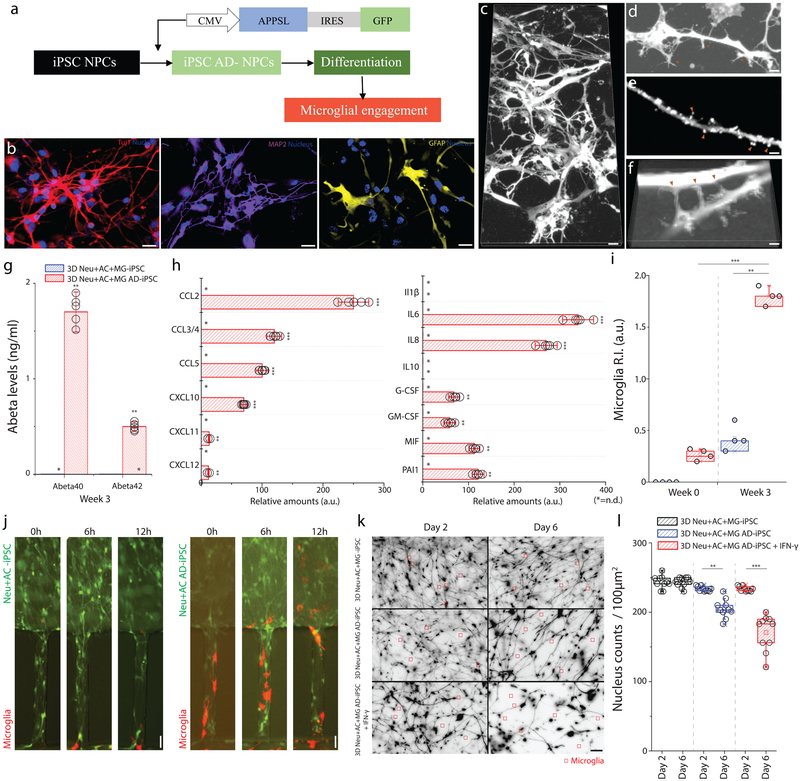
Figure 6. Neuron-glia interactions recapitulated with human iPSC-derived AD neurons/astrocytes.
(a) Schematics describe the procedure used to generate iPSC-AD NPCs and illustrate the plating. (b) Immunofluorescent microphotographs validate the differentiated neuron (blue: nucleus) with class III beta-tubulin Tuj1 (red) and MAP2 (purple), astrocytes (blue: nucleus) with GFAP (yellow) following 3-week of differentiation. (c) Representative microphotographs of differentiated neurons/astrocytes show (d) protrusion of dendritic spines, (e) synaptic boutons, and (f) connections. (g) 3D Neu+AC+MG AD-iPSC express elevated levels of Aβ40 and Aβ42 compared to the control (3D Neu+AC+MG -iPSC) (F (2, 4) = 125.6), All experiments were repeated ≥3 times. (h) The 3D Neu+AC+MG AD-iPSC also produces discernable amounts of chemokines (left) and pro-inflammatory soluble factors (right) (F (1, 22) = 321.3). (i-j) Tri-culture in 3D Neu+AC+MG AD-iPSC (red bars in i, right microphotographs in j) leads to a dramatic increase in microglia recruitment as measured by the total number of microglia accumulated in the CC compared to the 3D control (blue bars in i, left microscopic images in j) (R-square=0.7954, F (2, 12) = 199.7), All experiments were repeated ≥3 times: unpaired, Two-way ANOVA tests, ndevice= 5 at each culture condition. (k) Representative microscopic images show the reduced density of neurons/astrocytes tri-cultured with microglia (red square) after microglial engagement for 2 days and 6 days. (l) The amounts of surviving neurons/astrocytes are measured in 3D Neu+AC AD-iPSC treated with IFN-γ compared with untreated controls (3D Neu+AC+MG -iPSC, 3D Neu+AC AD-iPSC) ((R-square=0.9731, F (1, 10) = 17.45)). Two-way ANOVA test; Statistical significance is denoted by **p<0.001, ***p<0.0001 with numberdevice = 5 in (g, h, i). All parameters are presented as the mean ± SEM. Scale bars: 20 μm in (b, c, k), 5 μm in (d, e, f), 10 μm in (j), respectively.

