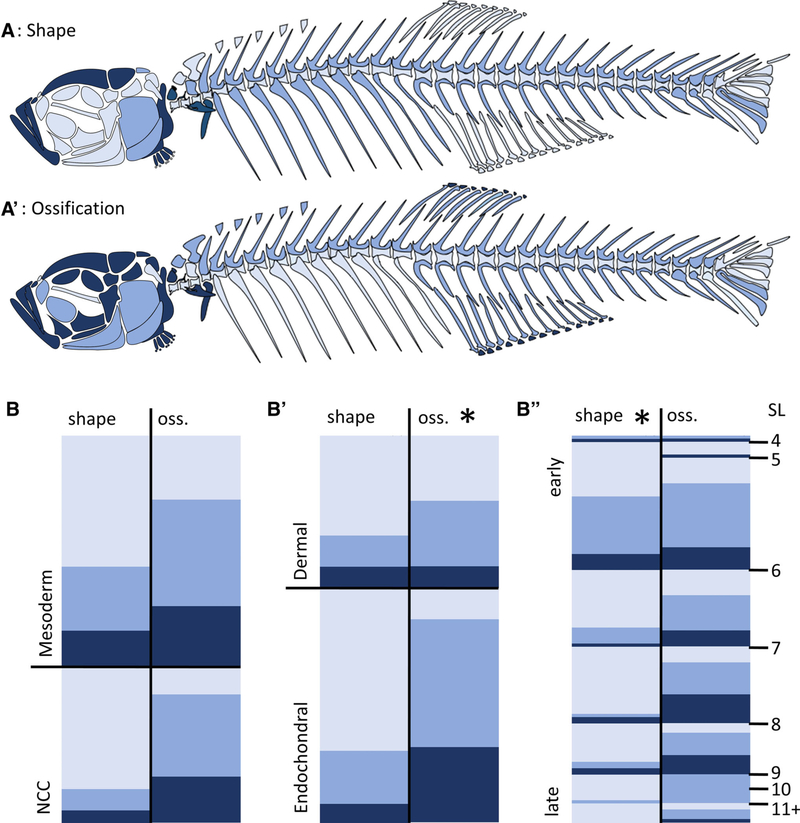
Fig. 8.
Global patterns of bone sensitivity to hypothyroidism (TH−). (A and A’): Schematics showing bones that do not achieve proper shape (A) or ossification (A’) in TH− backgrounds. (B) Heat maps show disruption in shape (left) and ossification (oss., right) for each bone sorted by different cellular origins (B, mesoderm vs. NCC), ossification profiles (B’, dermal vs. endochondral) and timing of ossification (B”). In (B”), bones are sorted by size range at which they ossify. Asterisks indicate significance within a category as determined by ordinal logistic regression. Light blue, unaffected; blue, moderately affected; dark blue, severely affected relative to euthyroid.

