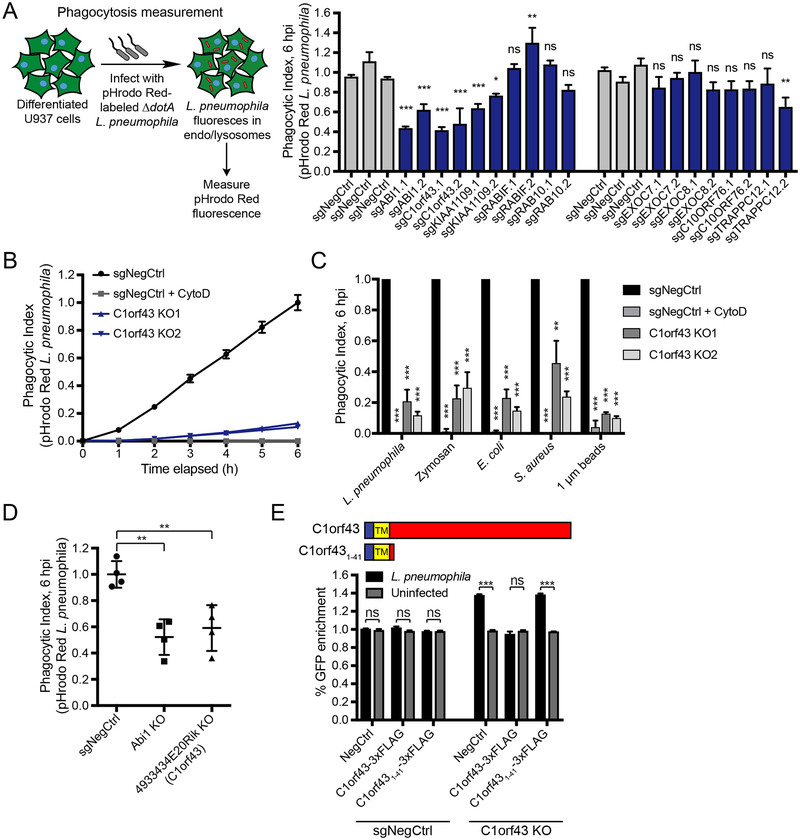
Figure 3. C1orf43 and KIAA1109 are regulators of phagocytosis.
(A) Effect of gene knockouts on phagocytosis. Differentiated U937 knockout cells (GFP+) were treated with pHrodo Red-labeled ΔdotA L. pneumophila at MOI = 10. Phagocytic index was measured as total mCherry fluorescence intensity at 6 h normalized to the number of GFP+ cells. Knockout cells were compared to three negative controls with the most stringent significance value reported (n = 4 technical replicates, one-way ANOVA, Dunnett’s multiple comparison test, ns = not significant, *P<0.05, **P<0.01, ***P<0.001; error bars, s.d.). Data shown are representative of 3 independent experiments.
(B) Timecourse measurements of pHrodo Red-labeled ΔdotA L. pneumophila phagocytosis for C1orf43 clonal knockout cells. Negative control cells treated with 5 μg/mL Cytochalasin D were used as a non-phagocytic control. Data represent mean ± s.d. of 4 technical replicates and are representative of 3 independent experiments.
(C) Phagocytosis of various prey particles in C1orf43 clonal knockout cells. U937 C1orf43 knockout clones or negative control cells were treated with pHrodo Red-labeled ΔdotA L. pneumophila, E. coli, S. aureus, zymosan, and 1 μm amino magnetic polystyrene beads and phagocytic index was measured at 6 h. Negative control cells treated with 5 μg/mL Cytochalasin D were used as a non-phagocytic control. Cytochalasin D-treated and C1orf43 knockout cells were compared to WT cells (n = 3 independent experiments, two-tailed Student’s t test, **P<0.01, ***P<0.001; error bars, s.d.
(D) Phagocytosis of L. pneumophila in Raw 264.7 mouse macrophages. Raw 264.7 cells were treated with pHrodo Red-labeled ΔdotA L. pneumophila and phagocytic index was measured at 6 h. Data represent mean ± s.d. of 4 individual knockout clones for each gene, with each clone used to perform the experiment in technical quadruplicates. Knockout cells were compared to negative control cells (n = 4 individual knockout clones, two-tailed Student’s t test, **P<0.01
(E) Overexpression of C1orf43 rescues C1orf43 knockout phenotype in a competitive killing assay. GFP+ U937 C1orf43 clonal knockout cells or negative control cells were lentivirally infected with constructs encoding C-terminal 3xFLAG-tagged full-length C1orf43 or the first 41 amino acids of C1orf43 (C1orf431–41), or a negative control (GFP). These cells were cocultured with mCherry+ negative control cells in equal numbers and infected with L. pneumophila at MOI = 100 or left uninfected. The percentage of GFP+ cells was measured by Incucyte and the % GFP change at 24 h was calculated. L. pneumophila-infected cells were compared to uninfected cells (n = 3 technical replicates, two-tailed Student’s t test with Holm-Sidak multiple comparisons correction, ns = not significant, ***P<0.001; error bars, s.d.). Data shown are representative of 2 independent experiments. Cartoon shows C1orf43 domain structure and C1orf431–41 truncation mutant. TM indicates the single-pass transmembrane domain in C1orf43.
See also Figure S3.

