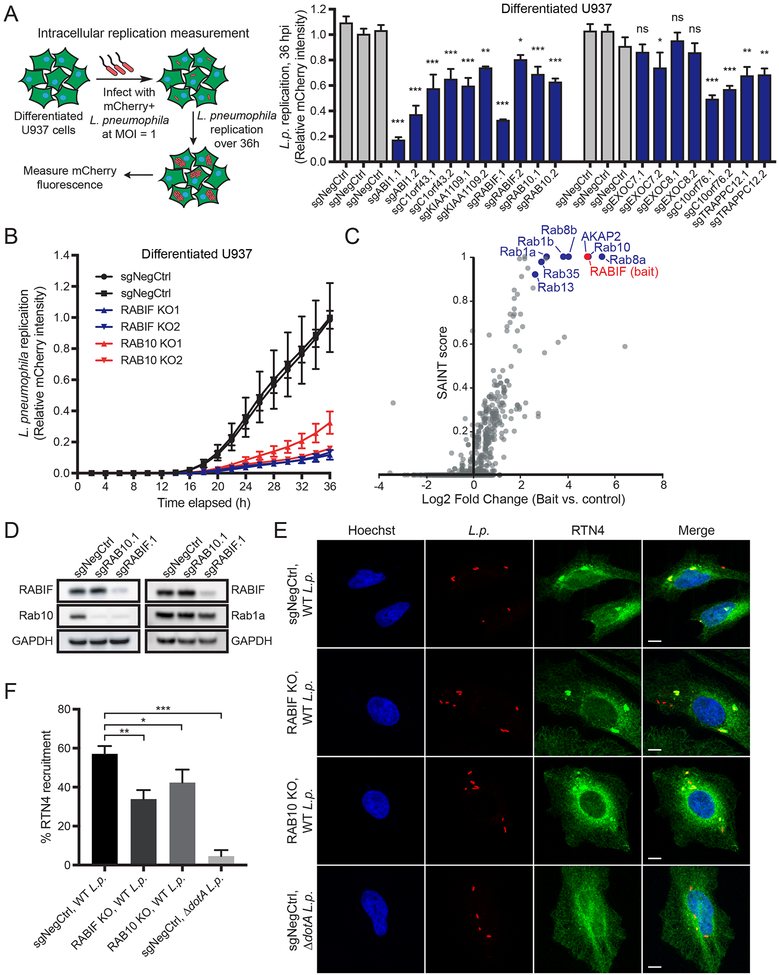
Figure 4. RABIF regulates L. pneumophila replication and ER recruitment to the LCV by stabilizing Rab10 expression.
(A) Effect of gene knockouts on L. pneumophila burden. Differentiated U937 knockout cells were infected with mCherry-expressing L. pneumophila at MOI = 1. Total mCherry fluorescence intensity per well was measured by Incucyte at 36 h as a combined metric of L. pneumophila uptake and intracellular replication. Knockout cells were compared to three negative controls with the most stringent significance value reported (n = 3 technical replicates, one-way ANOVA, Dunnett’s multiple comparison test, *P<0.05, **P<0.01, ***P<0.001; error bars, s.d.). Data shown are representative of 2 independent experiments.
(B) L. pneumophila intracellular replication analysis in RABIF and RAB10 clonal knockout cells. Differentiated U937 clonal knockout cells were infected with mCherry-expressing L. pneumophila at MOI = 1. Total mCherry fluorescence intensity was measured by Incucyte every 2 h for 36 h and compared between knockout cells and negative control cells. Data represent mean ± s.d. of 3 technical replicates and are representative of 2 independent experiments.
(C) Results from GFP-RABIF affinity purification followed by mass spectrometry (APMS). U937 cells stably expressing GFP-RABIF or GFP (negative control) were lysed and co-immunoprecipitated using anti-GFP beads. Each data point represents a protein identified by mass spectrometry. The x-axis shows log2 fold enrichment of the protein in the GFP-RABIF pull-down vs. GFP pull-down using the geometric mean of three experimental replicates. The y-axis shows the confidence score (SAINT score). Tabular AP-MS results are in Table S4.
(D) Immunoblot analysis of RABIF, Rab10, and Rab1a levels in U937 RABIF and RAB10 knockout cells or negative control cells.
(E) HeLa FcγRII RABIF and RAB10 clonal knockout cells or negative control cells were infected with WT or ΔdotA L. pneumophila (L.p.) at MOI = 1 for 4 h, fixed, and immunostained for L. pneumophila (red) and RTN4 (green). Nuclei were stained with Hoechst dye (blue). Scale bar, 10 μm.
(F) Quantification of the percentage of individual intracellular L. pneumophila co-localizing with RTN4. Knockout cells were compared to negative control cells for infection with WT L. pneumophila (n = 3 technical replicates with at least 50 LCVs analyzed per replicate, two-tailed Student’s t test, *P<0.05, **P<0.01, ***P<0.001; error bars, s.d.
See also Figures S4 and S5.

