Abstract
Background & Aims:
The CCNE1 locus, which encodes cyclin E1, is amplified in many types of cancer cells and is activated in hepatocellular carcinomas (HCCs) from patients infected with hepatitis B virus or adeno-associated virus type 2, due to integration of the virus nearby. We investigated cell cycle and oncogenic effects of cyclin E1 overexpression in tissues of mice.
Methods:
We generated mice with doxycycline-inducible expression of Ccnel (Ccne1T mice) and activated overexpression of cyclin E1 from age 3 weeks onwards. At 14 months of age, livers were collected from mice that overexpress cyclin E1 and non-transgenic mice (controls) and analyzed for tumor burden and by histology. Mouse embryonic fibroblasts (MEFs) and hepatocytes from Ccne1T and control mice were analyzed to determine the extent to which cyclin E1 overexpression perturbs S-phase entry, DNA replication, and numbers and structures of chromosomes. Tissues from 4-month-old Ccne1T and control mice (at that age were free of tumors) were analyzed for chromosome alterations, to investigate the mechanisms by which cyclin E1 predisposes hepatocytes to transformation.
Results:
Ccne1T mice developed more hepatocellular adenomas and HCCs than control mice. Tumors developed only in livers of Ccne1T mice, despite high levels of cyclin E1 in other tissues. Ccne1T MEFs had defects that promoted chromosome missegregation and aneuploidy, including incomplete replication of DNA, centrosome amplification, and formation of non-perpendicular mitotic spindles. Whereas Ccne1T mice accumulated near-diploid aneuploid cells in multiple tissues and organs, polyploidization was observed only in hepatocytes, with losses and gains of whole chromosomes, DNA damage, and oxidative stress.
Conclusions:
Livers, but not other tissues of mice with inducible overexpression of cyclin E1, develop tumors. More hepatocytes from the cyclin E1-overexpressing mice were polyploid than from control mice, and had losses or gains of whole chromosomes, DNA damage, and oxidative stress – all of these have been observed in human HCC cells. The increased risk of HCC in patients with hepatitis B virus or adeno-associated virus type 2 infection might involve activation of cyclin E1 and its effects on chromosomes and genomes of liver cells.
Keywords: AAV2, HBV, chromosome integrity, hepatocarcinogenesis
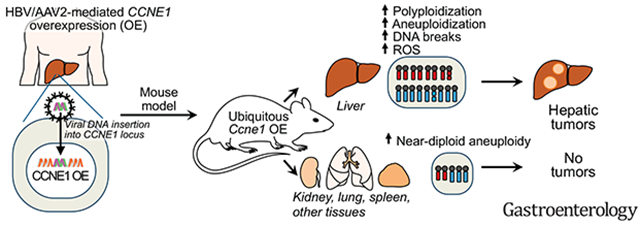
Graphical Abstract
Complexes of CDK2 and E-type cyclins (E1 and E2) trigger S-phase entry through phosphorylation of specific substrates, including members of the retinoblastoma protein (RB) family.1, 2 Combined genetic inactivation of cyclin E1 and E2 results in embryonic lethality during mid-gestation with placental and cardiac defects.3, 4 Elegant follow-up experiments using conditional knockout alleles in which ablation of E-type cyclins was postponed until the end of embryogenesis revealed that cyclin E1 and E2 are dispensable for postnatal growth and viability.5 Interestingly, however, when E-type cyclin-deficient mice were challenged with a carcinogen that causes liver cancer, they were found to be protected against tumor formation, indicating that, in contrast to normal cells, neoplastic cells cannot progress through S-phase in the absence of E-type cyclins. This dependence of tumor cells has been linked to CDK-independent functions of E-type cyclins in loading MCM helicase onto chromatin-bound CDT1.5, 6 Collectively, these insights led to speculation that agents targeting E-type cyclins could provide successful protection against tumor cell proliferation while leaving normal cells unperturbed.5
In addition to being required for tumor cell proliferation, cyclin E1 has been widely documented to be overexpressed in multiple human cancers, including ovarian, breast, lung and liver cancers, where it is thought to result in premature S-phase entry, ineffective DNA replication and genomic instability.7–9 Cell-cycle regulators are often expressed at elevated levels in human malignancies, which arguably could be a consequence of an increased mitotic index. However, this is unlikely to apply to cyclin E1 because the CCNE1 gene locus is frequently amplified in human tumors.10 Furthermore, recent studies have identified the CCNE1 locus as a viral integration site in 2-5% of HCCs of HBV-infected patients, resulting in marked upregulation of CCNE1 expression in tumorous versus normal liver tissue, presumably by viral enhancer elements.11–14 More than 50% of HCC patients worldwide are expected to develop from the estimated 350 million chronic HBV carriers,15 who have a 100-fold increased risk for acquiring HCC. A substantial number of HCC cases are therefore expected to have an HBV integration in CCNE1. The respiratory virus AAV2 infects up to 50% of the population.16 It is largely considered non-pathogenic and AAV2 derivatives are utilized in gene therapy approaches. However, recent studies have documented clonal insertions of AAV2 in 6% of HCC cases,17 sparking debate about the safety of these viral vectors in clinical trials. Importantly, one study reported that 3 of 11 HCC tumors with clonal AAV2 insertions showed viral integration in the CCNE1 locus.17
Here we investigated the consequences of cyclin E1 overexpression in mice using a doxycycline (dox)-inducible ubiquitous promoter. We found that these mice are prone to hepatocellular adenomas and HCCs and that hepatocytes with high levels of cyclin E1 have multiple features of human HCC cells, including increased polyploidization, losses and gains of whole chromosomes, DNA damage, and oxidative stress.
Methods
Mouse strains
All mice were housed in a pathogen-free barrier environment. Mouse protocols were reviewed and approved by the Mayo Clinic IACUC. All animals were maintained in a mixed 129/Sv × C57BL/6 genetic background. Ccne1-HA (PCR-amplified Ccnel cDNA with 3′ HA tag) transgenic mice were generated using KH2 ES cells (Origene Technologies) according to previously described methods.18 KH2 ES clones properly expressing Ccne1-HA were injected into blastocysts, and chimaeras from two independent Ccnel-HA (Ccne1T18 and Ccne1T20) clones achieved germline transmission. These transgenes were maintained on M2-rtTA (TA) hemizygous background (ROSA26). Both sexes were used for experimentation. At 3 weeks of age, transgenic mice were continuously administered 2 mg/ml doxycycline (#690902, Letco Medical) in drinking water containing 5% sucrose. At 14 months, mice were sacrificed and major organs were screened for overt tumors. Separate cohorts of mice were generated where dox was administered between 3 and 5, 5 and 7, or 3 and 16 weeks of age.
Generation and culture of MEFs
Ccne1T18 and Ccne1T20 MEFs were generated at embryonic day 13.5 and cultured as previously described.23 At least three independently generated MEF lines per genotype were used. Mitotic MEFs were prepared by culturing asynchronous cells for 5 h in medium containing 100 ng/ml nocodazole (#M1404, Sigma-Aldrich) and harvesting cells by “shake off”. Monastrol washout was carried out by sequentially treating MEFs with monastrol (#BML-GR322, Enzo life sciences) for 1 h, monastrol and MG132 (#C2211, Sigma-Aldrich) for 1 h followed by MG 132 alone for 90 min. Cells were then fixed with PBS/4% PFA for 10 min and stained with Hoechst.
Hepatocyte isolation and ploidy analysis
Hepatocytes from mouse livers were isolated by collagenase perfusion through the hepatic portal vein as described previously.41 Hepatocytes were purified by Percoll gradient centrifugation, counted and 1 million cells were used for propidium iodide (PI) staining and FACS analysis. Flow data were analyzed via pulse shape analysis in FlowJo 6.4.7.
Partial hepatectomy
Partial hepatectomies were performed on 8-10-week-old male mice, induced with dox from 3 weeks of age, as described.42 Forty-eight h after the surgery, mice were sacrificed, the liver lobes were collected and fixed in PBS/4% PFA for immunostaining.
Western blot analysis
Western blot analysis was carried out as previously described.23 Subcellular fractionation was performed per manufacturer’s protocol (Thermo Scientific, #78840 or #87790). Primary antibodies used for western blotting are listed in Supplemental Table 1.
Statistical analyses
GraphPad Prism software was used for all statistical analyses. Graphs are indicated with the significance score of *P < 0.05, **P < 0.01 and ***P < 0.001. We note that no power calculations were used. Sample sizes were based on previously published experiments where differences were observed. No samples were excluded. Investigators were not blinded to allocation during experiments and outcome assessment.
Aneuploidy analyses
Chromosome counts were carried out on metaphase spreads from colcemid-treated transgenic MEFs grown in the presence or absence of dox for 48 h or on splenocytes of 5-month-old transgenic mice treated with dox since weaning.23 Interphase FISH analysis with probes for chromosomes 4 and 7 was carried out on single-cell suspensions of various tissues and tumors as previously described.23
Single-cell Whole Genome Sequencing (scWGS)
scWGS on liver tissue from 4-month-old mice (on dox from weaning) was performed as described previously.43 FACS sorted tetraploid (4n) cells were exclusively used for preparing libraries and sequencing. Copy number alterations and segmental aneuploidy score were determined using the AneuFinder software.43
In vitro kinase assay
Kinase assays were performed as previously described.44
Additional methods are described in the supplementary section.
Results
Generation of cyclin E1 overexpressing mice
To achieve ubiquitous overexpression of full-length cyclin E1 in mice, we generated dox-inducible Ccnel transgenic animals using FLP/Frt-mediated site-directed integration 3′ of the Col1A1 locus of KH2 embryonic stem (ES) cells (Figure 1A).18 Two independent transgenic strains were obtained, referred to as Ccne1T18 and Ccne1T20 (in experiments where both lines were used interchangeably, they are denoted as Ccne1T). Tissues and MEFs from both strains showed high overexpression of cyclin E1 protein in the presence of dox, whereas no transgene expression was observed in its absence (Figure 1B and C, Supplementary Figure 1A). In MEFs, both protein and transcript levels were elevated about 40-fold (Supplementary Figure 1B and C).
Figure 1.
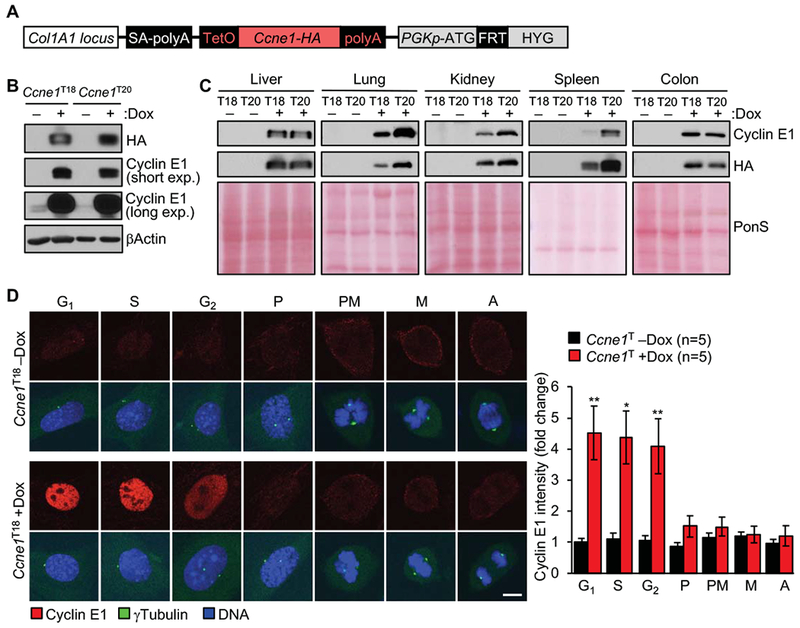
Generation of Ccnel transgenic mice. (A) Ccnel transgene integrated in the Col1A1 locus. (B) Western blots of lysates of Ccne1T MEFs cultured in the presence or absence of dox for 72 h and probed for HA and cyclin E1. β-actin served as loading control. (C) Western blots of tissue extract from the indicated 6-week-old transgenic mice. Ponceau S (PonS) staining of blotted proteins served as a loading control. (D) Left: MEFs at various stages of cell cycle stained for cyclin E1. γTubulin staining was used for cell cycle staging. P, prophase; PM, Prometaphase; M, Metaphase; A, Anaphase. Right: Quantification of cyclin E1 signals (normalized to -dox G1 expression). Data represent mean ± s.e.m. Statistics: D, two-tailed paired t-test. *P < 0.05, **P < 0.01. Scale bar, 5 μm.
Cyclin E1 overexpression disrupts Cdk-dependent and -independent functions
Cyclin E1 levels of dox-treated MEFs were highly elevated in G1, S and G2 phase, yet normal in mitosis, suggesting that proteolytic degradation occurs before M phase entry (Figure 1D). Immunolabeling of MEFs with an antibody against phosphorylated Cdk (pCdk) substrates suggested that cyclin E1 overexpression had no impact on global Cdk activity (Figure 2A and B). Furthermore, Cdk2 immunoprecipitated from asynchronous Ccne1T MEFs cultured in the presence of dox did not show elevated activity in an in vitro kinase assay with Histone H1 as substrate (Supplementary Figure 2). On the other hand, serum-starved Ccne1T MEFs released in serum-containing medium with dox showed accelerated phosphorylation of Rb1 and precocious S-phase entry as evidenced by the premature induction of cyclin A2 (Figure 2C). Consistent with this, fluorescence ubiquitination cell cycle indicator (FUCCI) analysis revealed a significant shortening of G1 phase in dox-treated Ccne1T MEFs (Figure 2D). Furthermore, a small subset of proteins detected by the pan Cdk substrate antibody on immunoblots was expressed at elevated levels in these cells (Figure 2C), implying that cyclin E1 overexpression alters Cdk substrate phosphorylation in a select rather than a global manner.
Figure 2.
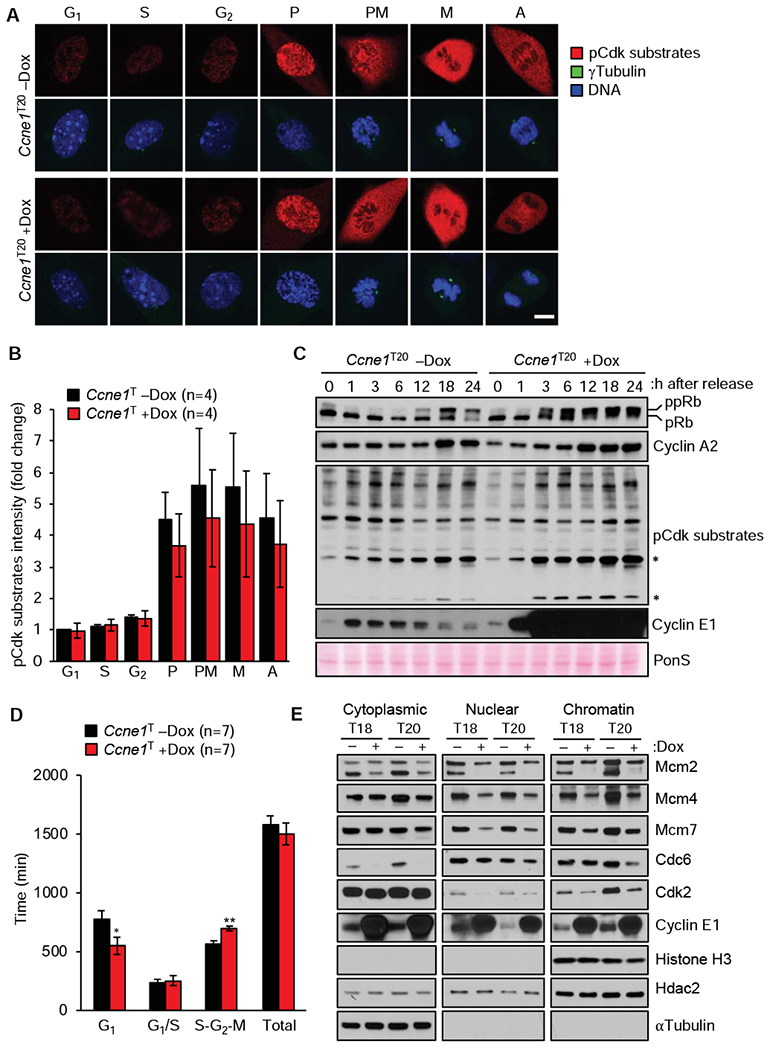
High transgenic expression of cyclin E1 alters cell-cycle timing. (A) Representative images of dox-treated and untreated Ccne1T MEFs at the indicated stages of cell cycle immunolabeled for phosphorylated Cdk substrates. Scale bar, 5 μm. (B) Quantification of pCdk substrate signals of the indicated MEFs at various stages of the cell cycle (normalized to -dox G1, signals). (C) Western blots of lysates of Ccne1T MEFs harvested at the indicated time points after release from serum starvation in the presence or absence of dox. Asterisks mark hyperphosphorylated Cdk substrates. (D) Analysis of the indicated MEFs by FUCCI technology. (E) Western blots of fractionated lysates of MEFs grown with or without dox for 72 h. Histone H3, Hdac2, and αTubulin represent chromatin, nuclear and cytoplasmic markers, respectively. Data in B and D represent mean ± s.e.m. Statistics: B and D, two-tailed paired t-test. *P < 0.05, **P < 0.01.
Cyclin E1 also has a Cdk-independent function in loading the MCM DNA helicase complex onto origins of replication to drive initiation and elongation of DNA replication in S phase.5, 6 To examine whether this function was perturbed with cyclin E1 overexpression, we compared cytoplasmic, nuclear and chromatin-associated levels of key MCM proteins between dox-treated and untreated Ccne1T MEFs, including Mcm2, 4 and 7. All three of these proteins were reduced in both the nuclear and chromatin fractions of cyclin E1 overexpressing cells (Figure 2E), predicting DNA replication stress and chromosomal instability (CIN). Furthermore, cytoplasmic levels of Mcm2, but not Mcm4 and 7, were also reduced.
Cyclin E1 overexpression causes a complex CIN phenotype in MEFs
To examine the impact of cyclin E1 overexpression on chromosomal instability (CIN) we prepared metaphase spreads of Ccne1T MEFs cultured in the presence or absence of dox and performed chromosome counts. Aneuploidy rates were indeed elevated with cyclin E1 overexpression (Figure 3A and Supplementary Figure 3A). Consistent with this, live-cell imaging of Ccne1T MEFs stably overexpressing H2B-mRFP demonstrated that chromosome missegregation rates were elevated in the presence of dox, with both lagging chromosomes and chromatin bridges driving the increase (Figure 3B). Phosphorylation of Chk1 at Ser345, a marker of replication stress associated with chromatin bridge formation19, was elevated in dox-treated Ccne1T MEFs (Supplementary Figure 3B). FUCCI analysis revealed that cyclin E1 overexpression extends S-G2-M, providing further evidence for replication stress (Figure 2D). Furthermore, DNA fiber assays showed that cyclin E1 overexpression increases replication fork stalling (Supplementary Figure 3C). Un-replicated single-stranded DNA at stalled replication forks is vulnerable to breakage. Indeed, in immunolabeling experiments for γH2AX, 53BP1 and RPA2, cyclin E1 overexpressing MEFs showed elevated rates of double-stranded DNA breaks (DSBs; Supplementary Figure 3D and E). Furthermore, cyclin E1 overexpressing cells had high p53 activity, a feature of cells with DSBs (Supplementary Figure 3F). These data indicate that incomplete DNA replication contributes to chromatin bridge formation in cyclin E1 overexpressing MEFs.
Figure 3.
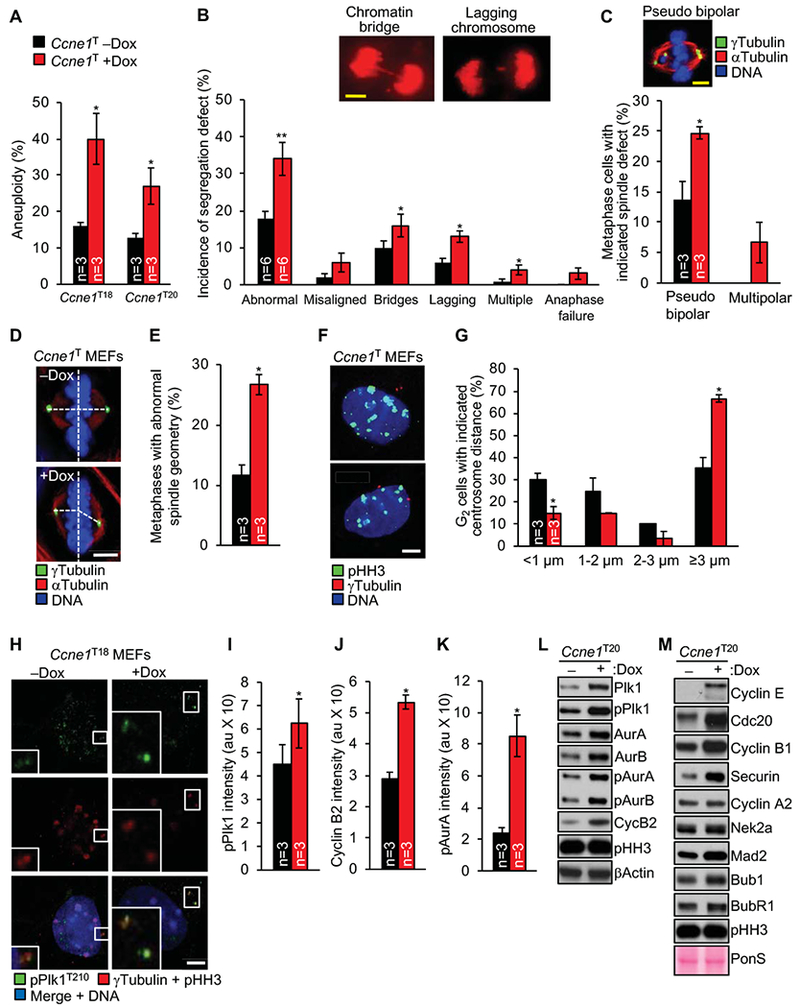
Cyclin E1 overexpression causes chromosome segregation errors and aneu-ploidy in MEFs. (A) Chromosome counts on metaphase spreads of the indicated MEFs. (B) Chromosome segregation analysis of MEFs expressing H2B-mRFP. Images: Ccne1T MEFs with indicated segregation errors. (C) Incidence of pseudobipolar or multipolar spindles in metaphases stained for αTubulin and γTubulin. Image: Ccne1T MEF with indicated spindle defect. (D) Representative metaphases with perpendicular (top) and non-perpendicular spindles (bottom). (E) Incidence of non-perpendicular metaphase spindles. (F) Representative images of G2 MEFs with normal (top) and premature (bottom) centrosome disjunction. (G) Measurements of centrosome separation in G2 MEFs staged for equal pHH3 expression. (H) Representative images of pPlk1-stained prophases grown with and without dox. (I) Quantification of pPlk1 levels at centrosomes (normalized to γTubulin levels). (J, K) As in H for cyclin B2 and pAurA, respectively. (L, M) Western blots of mitotic shake-off lysates probed for the indicated proteins. Data in A-C, E, G, I-K represents mean ± s.e.m. Statistics: A-B, E, G, I-K, two-tailed paired t-test. C, two-tailed unpaired t-test *P < 0.05, **P < 0.01. Scale bars, 5 μm.
Next, we assessed how cyclin E1 overexpression promotes the formation of merotelic attachments that produce lagging chromosomes. These attachments can form through multiple mechanisms, including centrosome amplification,20 aberrant centrosome dis-junction or movement,21 defective attachment error correction,22 and accelerated mitotic timing. Error correction and timing of mitosis were not impacted by cyclin E1 overexpression (Supplementary Figure 3G and H). However, cyclin E1 overexpression led to the formation of merotely-prone pseudobipolar mitotic spindles with supernumerary centrosomes, as revealed by immunolabeling for γTubulin and αTubulin (Figure 3C). Furthermore, spindle poles of cyclin E1 overexpressing MEFs with normal centrosome numbers frequently failed to align perpendicularly to the metaphase plate (Figure 3D and E). Such non-perpendicular spindles can result from aberrant disjunction or movement of duplicated centrosomes, and are a source of merotelic attachments.21 Analysis of γTubulin-stained MEFs revealed that centrosome disjunction in G2 was accelerated at high cyclin E1 levels (Figure 3F and G), a phenotype that is consistent with the aberrantly high levels of centrosome-associated cyclin B2, pAurA, and pPlk1 (Figure 3H–K and Supplementary Figure 4A and S).23 Western blot analysis of lysates of prometaphase-arrested MEFs confirmed that cyclin B2, Plk1, pPlk1, AurA and pAurA levels were elevated with cyclin E1 overexpression, as were AurB and pAurB (Figure 3L). All these mitotic regulators are E2F target genes, further supporting that cyclin E1 overexpression deregulates Cdk activity. We note that even though centrosome-association and phosphorylation of Eg5 were unperturbed (Supplementary Figure 4C and D) a small proportion of cyclin E1 transgenic MEFs showed slow centrosome movement, which could contribute to lagging chromosome formation (Supplementary Figure 4E).
The observation that cyclin E1 overabundance increases the expression of key regulators of bipolar spindle assembly, prompted us to conduct a more comprehensive analysis of mitotic regulator levels in mitotic shake-off lysates of dox-treated and untreated MEFs (Figure 3M). Cdc20, a key activator of APC/C, was highly elevated in dox-treated CcneT20 MEFs. Key substrates of APC/CCdc20 were either present at normal levels, such as Nek2a and cyclin A2, or substantially elevated, such as securin and cyclin B1. Securin and cyclin B1 both inhibit separase-mediated cleavage of cohesin, raising the possibility that their overabundance causes anaphase bridge formation through non-disjunction of sister chromosomes. Even though two core mitotic checkpoint proteins, Bub1 and Mad2, were mildly elevated, spindle assembly checkpoint activity remained unperturbed with cyclin E1 overexpression (Supplementary Figure 4F). The observed increases in cyclin B1, Mad2, Bub1, and securin may be due to the fact that they are transcriptionally regulated by E2F.24 Nek2a and cyclin A2 are as well, but they are not elevated, which could be due to increased APC/CCdc20-driven proteasomal degradation. Collectively, the above data reveal that cyclin E1 overexpression disrupts cell-cycle control and causes CIN in MEFs.
Ubiquitous cyclin E1 overexpression selectively induces tumors in liver
To assess the impact of cyclin E1 overexpression on tumorigenesis, we generated cohorts of Ccne1T18, Ccne1T20 and TA control mice that were on dox-containing water from 3 weeks (weaning) onwards. These mice were sacrificed and screened for tumors at 14 months of age. Tumors were collected and subjected to histopathological evaluation. Both Ccnel transgenic lines showed a dramatic increase in tumor incidence, which was solely driven by a strong predisposition for liver tumors (Figure 4A). Eight of 22 liver tumors that we evaluated were HCCs, while the remainder lesions were hepatic adenomas (Figure 4B–D). Furthermore, non-neoplastic proliferative lesions that are thought to be pre-neoplastic25 were frequently observed in Ccne1T livers, but not in TA control livers (Figure 4E and F). Taken together, these data demonstrate that high cyclin E1 overexpression selectively drives neoplastic growth of mouse hepatocytes. Importantly, these data further imply that high overexpression of cyclin E1 in HCCs of chronically infected HBV or AAV2 patients with viral integrations in the CCNE1 locus might be disease causing.
Figure 4.
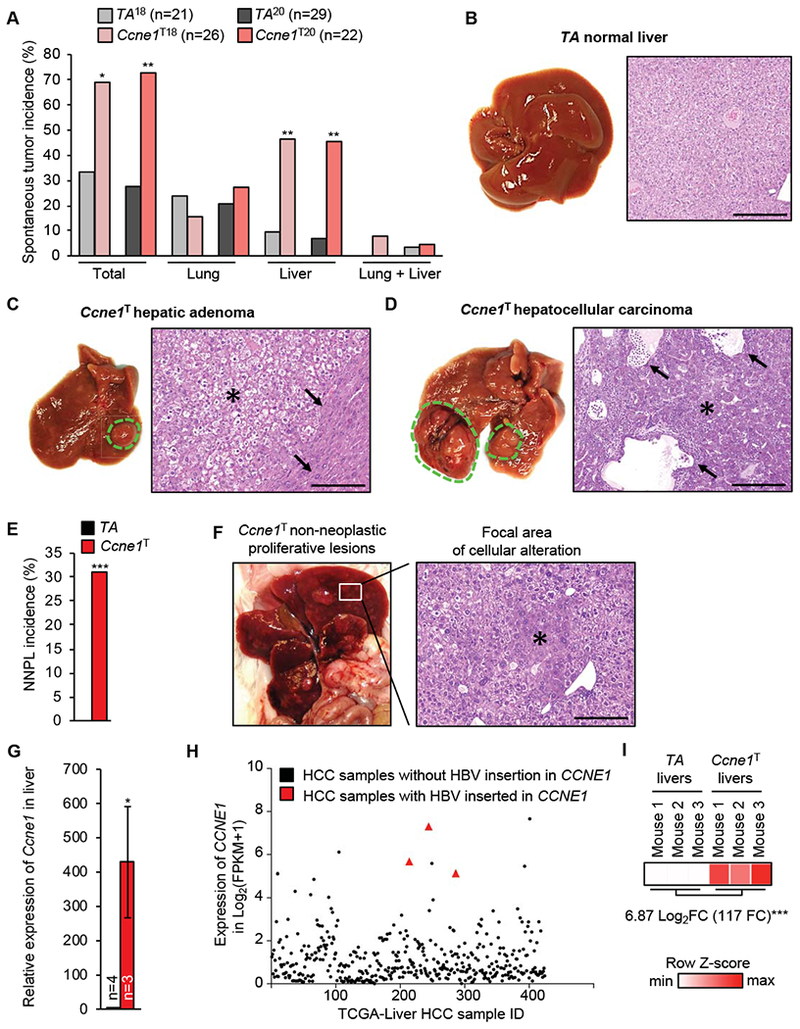
Cyclin E1 overexpression selectively induces tumors in liver. (A) Spontaneous tumor incidence in 14-month-old mice induced with dox from weaning (organs not included did not have noteworthy tumor incidence). (B) Gross image and histology of a 14-month-old TA liver. (C) Gross image and histology of a Ccne1T hepatocellular adenoma (*), with loss of normal lobular architecture and irregular growth pattern, compressing the surrounding liver parenchyma (arrows). (D) Gross image and histology of a Ccne1T hepatocellular carcinoma, with trabecular (*) and adenoid growth pattern and cystic dilation of the adenoid structures (arrows). (E) Incidence of non-neoplastic proliferative lesion (NNPL). (F) Gross image and histology of a Ccne1T liver with a focal area of cellular alteration (*). (G) RT-qPCR analysis of Ccnel transcripts in 4-month-old livers of indicted genotypes. Data represent mean ± s.e.m. (H) RNA sequencing-based expression values of CCNE1 in the indicated HCC samples of the TCGA cohort. (I) RNA sequencing-based Ccnel expression values for the indicated 4-month-old mouse livers. FC, fold change. Statistics: A and E, two-tailed Fisher’s exact test; G, two-tailed unpaired t-test. *P < 0.05, **P < 0.01, ***P < 0.001. Scale bars, 1 mm (B-D) and 300 μm (F).
To determine the extent to which Ccne1T represents a faithful model for these patients, we assessed whether levels of CCNE1 overexpression reported in HCC samples with HBV or AAV2 integrations were similar to those of seen in livers of dox-treated Ccne1T mice. Three HCC samples with AAV2 insertions on average have 470-fold higher CCNE1 transcript levels than normal liver tissue without viral integrations, as assessed by RT-qPCR.17 Using a similar approach, we found that livers of 4-month-old Ccne1T mice had 428-fold higher Ccnel transcript levels than those of age-matched TA control mice (Figure 4G). Using RNA sequencing, we determined that CCNE1 transcript levels of 3 HCC samples with HBV integrations in CCNE1 ranked 2nd, 4th and 7th among 424 HCC samples in the TCGA cohort (Figure 4H). On average, these 3 tumors had 32-fold higher transcript levels than corresponding tumors without such insertions. RNA sequencing on livers of 4-month-old Ccne1T and TA control mice revealed a 117-fold increase in Ccnel transcript levels of transgenic livers (Figure 4I). Collectively, these data indicate that our Ccne1T transgenic mice constitute a reasonably faithful model for HCC tumors with AAV2 or HBV insertions.
Cyclin E1 overexpression causes near polyploid aneuploidy in the liver
To understand the mechanism(s) by which cyclin E1 overexpression promotes neoplastic transformation in hepatocytes, we characterized the impact of transgene induction at 3 weeks (the age we started dox treatment in our tumor susceptibility study) on genomic content, and numerical and structural chromosome integrity in these cells. Mouse hepatocytes remain in a proliferative mode during the first few weeks of postnatal life and then exit the cell cycle to become quiescent, a process that is largely completed by 4 weeks of age. At this point, quiescent hepatocytes are mononuclear with 2n or 4n DNA content, or binucleated with 2 × 2n DNA content.26
As expected, 5-week-old TA control mice that we treated with dox for 2 weeks after weaning showed a marked reduction in proliferating cells compared to 3-week-old mice, as evidenced by both staining for the mitotic marker phospho-histone H3Ser10 (pHH3) and EdU incorporation (Figure 5A and B). In contrast, dox-treated Ccne1T counterparts sustained rates of hepatic cell division characteristic to the proliferative phase of post-natal liver development. In animals treated with dox for 2 weeks starting at 5 weeks of age, after cells had entered the quiescent phase, cyclin E1 overexpression also significantly increased hepatic cell proliferation, albeit to a lesser extent than from 3 to 5 weeks (Figure 5A and B). Furthermore, although hepatic cell proliferation rates in Ccne1T mice treated with dox between 3 and 16 weeks of age remained significantly elevated over TA control mice, they were much lower than those observed between weeks 3 and 5 (Figure 5A and B). Collectively, these findings indicate that cyclin E1 overexpression increases hepatic cell proliferation irrespective of the timing of transgene induction. Cyclin E1 overexpression significantly decreased the proportion of bi-nucleated hepatocytes, a finding that is indicative of cellular stress (Figure 5C).
Figure 5.
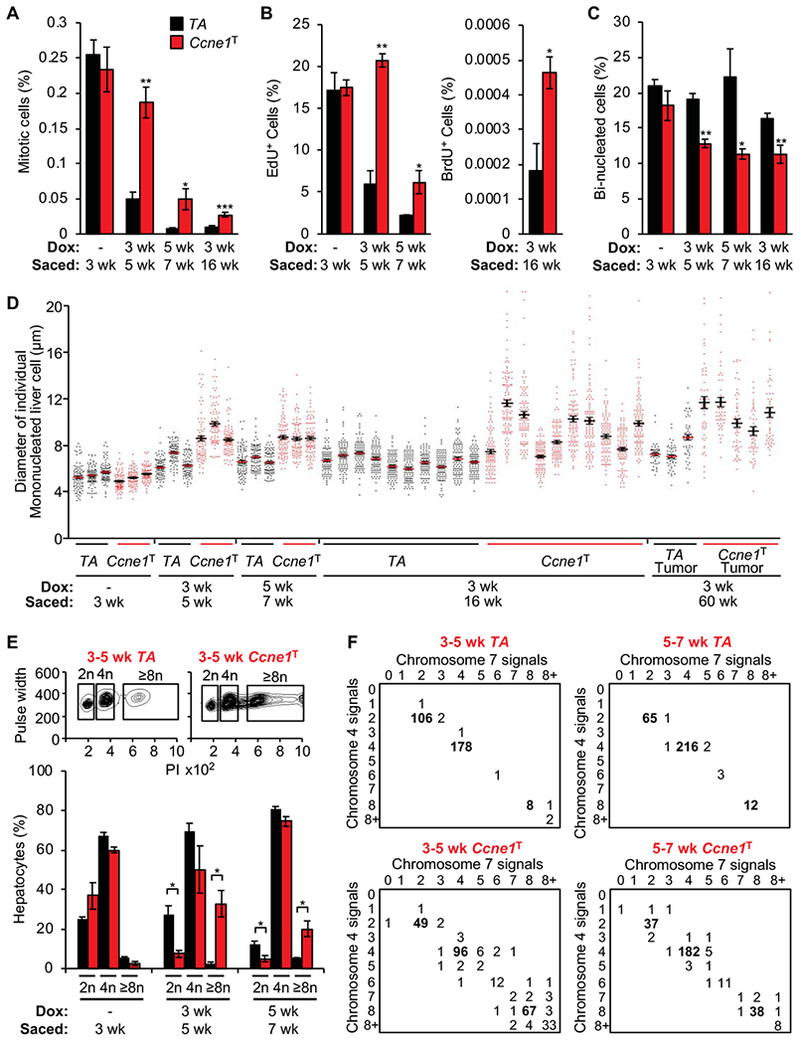
Cyclin E1 overexpression causes near polyploid aneuploidy in the liver. (A) Quantification of mitotic cells in liver sections immunostained with pHH3 (n=3 per group except for the 3-16-week group where n=10 per group). (B) Quantification of EdU or BrdU-positive cells in liver sections of the indicated mice (n=3 per group except for 3-16 week where n= 11 per group). (C) Quantification of binucleated hepatocytes in H-E-stained liver sections (n=3 per group except for the 3-16-week group where n=10 per group; n=200 hepatocytes per group). (D) Hepatocyte diameters in the indicated liver or liver tumor samples (each column represents 1 liver or liver tumor; n=200 hepatocytes per sample). (E) Top: Flow cytometry profiles of hepatocyte ploidy as assessed by propidium iodide (PI) staining. Bottom: Quantification of hepatocyte DNA contents into diploid (2n), tetraploid (4n) and polyploid (≥8n) cell fractions (n=3 mice per group). (F) FISH analysis for chromosome 4 and 7 signals on the hepatocyte suspensions used in E (n=3 per group; n=100 hepatocytes per sample). Data represent mean ± s.e.m. Statistics: A-E, two-tailed unpaired t-test. *P < 0.05, **P < 0.01, ***P < 0.001.
Hepatocyte nuclear diameter measurements showed that cyclin E1 overexpression markedly increased nuclear size, regardless of whether transgene induction occurred during the proliferative or quiescence phase of liver development (Figure 5D). Comparison of Ccne1T mice treated with dox for 2 or 13 weeks starting at 3 weeks of age indicated that this nuclear enlargement phenotype was progressive, at least in a subset of mice (Figure 5D). Hepatic tumors collected from 14-month-old dox-treated Ccne1T mice had a very similar nuclear enlargement phenotype as livers from 4-month-old dox-treated Ccne1T mice (Figure 5D). Nuclear size enlargement was not commonly observed in liver tumors from 14-month-old dox-treated TA mice (Figure 5D). FACS analysis of hepatocyte suspensions demonstrated that nuclear size enlargement with cyclin E1 overexpression is caused by polyploidization, irrespective of whether transgene induction occurs during the proliferative or quiescent phase of liver development (Figure 5E). FISH analysis of these same suspensions revealed that cyclin E1-induced polyploidization is frequently accompanied by aneuploidization (Figure 5F, Supplementary Figure 5A). FISH analysis on cell suspensions of other tissues from cyclin E1 overexpressing mice, including kidney, lung and spleen, uncovered no evidence for polyploidization, although kidney and lung were prone to near-diploid aneuploidy (Supplementary Figure 5B and C). BrdU incorporation experiments confirmed that cyclin E1 overexpression increased cell proliferation in kidney and spleen (Supplementary Figure 5D). Collectively, the above findings indicate that cyclin E1 overexpression promotes hepatocyte proliferation, polyploidization and aneuploidization.
High cyclin E1 causes chromosome missegregation and DSBs in hepatocytes
Next, we examined the extent to which the CIN phenotype observed in cyclin E1 overexpressing MEFs is conserved in hepatocytes. First, we immunolabeled liver sections from dox-treated Ccne1T and TA mice for pHH3 and inspected mitotic figures for aberrantly arranged chromosomes. Chromosome misalignment outside of the metaphase plate was markedly increased in hepatic cells overexpressing cyclin E1, regardless of the timing of transgene induction (Figure 6A). We also observed a trend towards increased chromosome lagging, but anaphases were hard to find and values did not reach statistical significance. However, with the application of partial hepatectomy to stimulate cell division, we observed a high incidence of anaphases with lagging chromosomes upon cyclin E1 overexpression (Figure 6S). Importantly, this correlated with high rates of non-perpendicular spindles (Figure 6C), which are enriched in merotelic microtubule-kinetochore attachments that produce lagging chromosomes.21 Missegregation of whole chromosomes due to cyclin E1 overexpression was confirmed by single-cell genomic DNA sequencing on FACS-sorted hepatocytes with 4n DNA content (Figure 6D and E). Furthermore, focal amplifications and losses of chromosome segments were significantly increased with cyclin E1 overexpression (Figure 6D and F).
Figure 6.
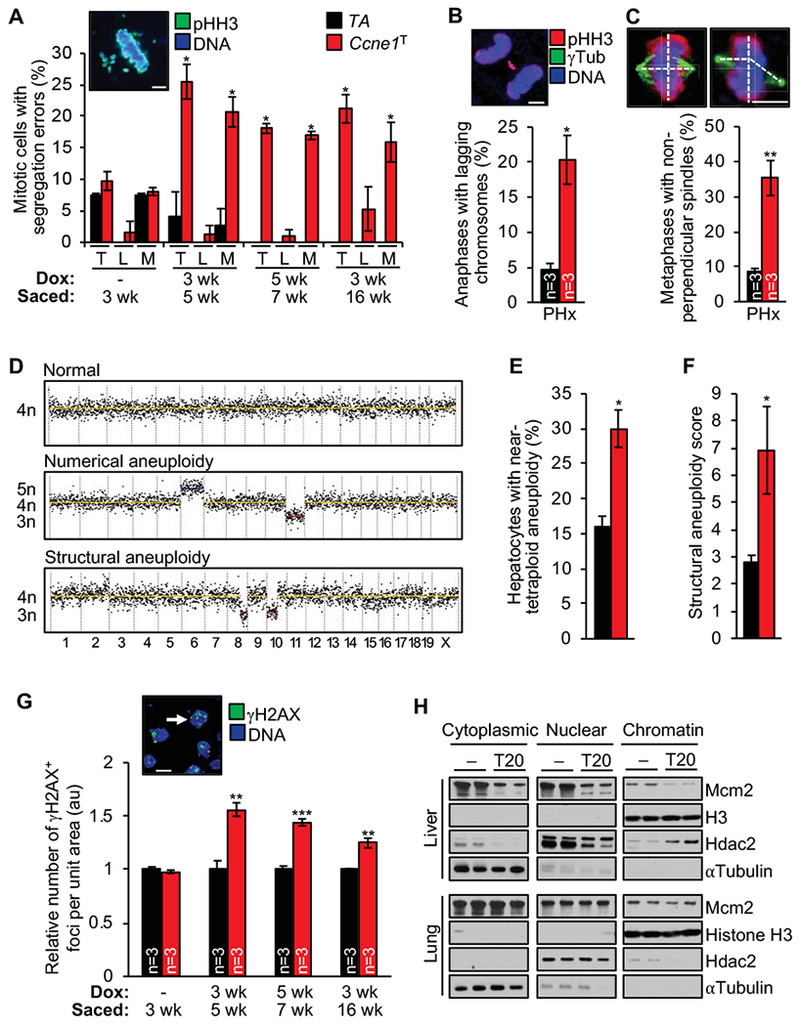
Cyclin E1 overexpression causes a complex CIN phenotype in hepatocytes. (A) Chromosome segregation errors (T, total, L, lagging, M, misaligned) in liver sections of the indicated mice (n=3 per group except for the 3-16-week group where n=9 per group). Inset, representative image of a cell in metaphase with misaligned chromosomes. (B) Quantification of anaphases with lagging chromosome in liver sections of the indicated 8-week-old mice 48 h after partial hepatectomy (PHx). Image shows a representative Ccne1T hepatocyte with a lagging chromosome. (C) Quantification of metaphases with non-perpendicular spindles in samples described in B. Images show metaphases with perpendicular (left) and non-perpendicular spindles (right). (D) Representative segmentation plots of single tetraploid liver nuclei with normal ploidy, numerical aneuploidy and structural aneuploidy. (E, F) Numerical and structural aneuploidy assessments by single-cell DNA sequencing of hepatocytes FACS-sorted for 4n DNA content (n=4 mice per group, 15-22 hepatocytes per mouse). (G) Quantification of γH2AX foci per nuclear area in liver sections of the indicated mice. Image represents γH2AX staining for liver cryosections at 4 months of age (arrow indicates a hepatic cell with an abundance of γH2AX-positive foci). (H) Western blots of fractionated lysates of liver and lung tissue Histone H3, Hdac2, and αTubulin represent chromatin, nuclear and cytoplasmic markers, respectively. Data represents mean ± s.e.m. Statistics: A-G, two-tailed unpaired t-test. *P < 0.05, **P < 0.01. Scale bars, 5 μm.
Segmental chromosome rearrangements require DSBs, which prompted us to determine whether this form of DNA damage was also increased in hepatocytes overexpressing cyclin E1. Indeed, immunolabeling of liver sections for γH2AX revealed that cyclin E1 overexpression significantly increased DSB formation, regardless of the timing of transgene induction (Figure 6G). The increase in DSBs did not appear to be simply the result of a higher ploidy status, and was selective for liver (Supplementary Figure 6A). Consistent with our observations in MEFs, elevated cyclin E1 levels in liver resulted in a reduction of Mcm2 in cytoplasmic, nuclear and chromatin fractions, indicative of replication stress (Figure 6I). No such declines were observed in lung, kidney and spleen, all of which failed to show evidence for increased DSBs (Figure 6G and I, and Supplementary Figure 6B).
High cyclin E induces extensive transcriptional changes selectively in liver
To better understand why cyclin E1 overexpression selectively promotes liver tumorigenesis, we conducted genome-wide transcriptome profiling on liver, kidney and lung samples of 4-month-old dox-treated Ccne1T and TA mice. Hierarchical clustering based on gene expression pattern similarity grouped liver samples by genotype, but not kidney and lung samples (Figure 7A). In liver, cyclin E1 overexpression induced widespread transcriptional changes, with 2469 transcripts upregulated and 2496 transcripts down-regulated (Figure 7B). In contrast, cyclin E1 overexpression altered <100 genes in kidney and lung (Figure 7B), even though the extent of Ccnel expression was similar in all 3 tissues (Supplementary Figure 7A). Using functional annotation analyses on the up-regulated differentially expressed genes (DEGs), we identified hundreds of significantly enriched annotations in cyclin E1 overexpressing livers. We classified these into functional clusters (Figure 1C, Supplementary Figure 7B and C). One cluster indicated that overexpression of cyclin E1 increases oxidative phosphorylation (Figure 7D), in turn leading to oxidative stress (Figure 7E), a key feature of various human liver diseases, including HCC.27–29 Staining of livers from 4-month-old mice with the ROS-sensitive dye dihydroethidium (DHE) validated that cyclin E1 overexpression creates oxidative stress in the liver (Figure 7F).
Figure 7.
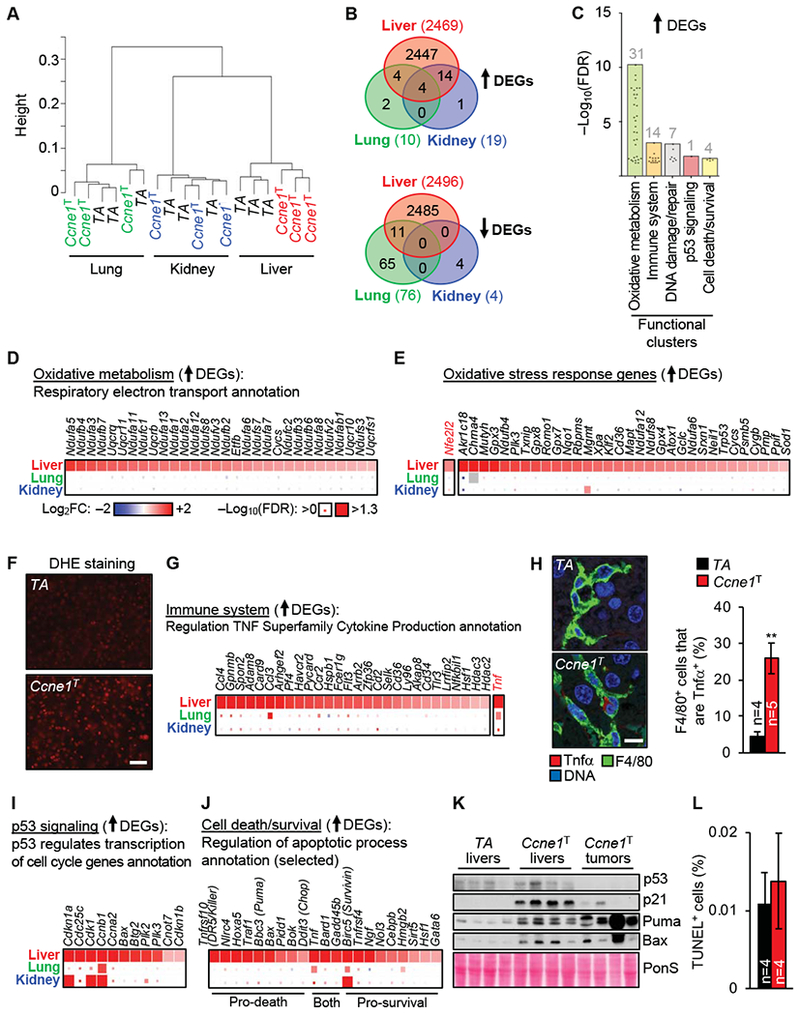
Identification of pro-tumorigenic changes in preneoplastic livers of mice overexpressing cyclin E1. (A) Hierarchical clustering using RNA sequencing data from lung, liver and kidney of the indicated 4-month-old mice. The y-axis represents the metric 1-Pearson correlation as distance between samples. (B) Venn diagrams depicting numbers of significantly up- or downregulated differentially expressed genes (DEGs) in the indicated Ccne1T tissues versus corresponding TA tissues. (C) Selected functional clusters overrepresented in upregulated DEGs from Ccne1T versus TA livers. Points within each cluster represent individual annotations. The total number of annotations per cluster is indicated. FDR, false discovery rate. (D) Heatmap of upregulated DEGs for the indicated annotation. Depicted are log2 fold expression changes in Ccne1T versus TA tissues (box color) and the significance per gene (box size). (E) Heatmap of upregulated DEGs generated from GO annotation “Response to oxidative stress”. (F) Representative images of cryo-sections of the indicated 4-month-old livers stained with DHE. Scale bar, 40 μm. (G) Heatmap of upregulated DEGs for the indicated annotation within the immune system cluster. (H) Left: Images of representative liver sections of the indicated 4-month-old mice immunolabeled for Tnfα and F4/80. Scale bar, 10 μm. Right: Quantitation of Tnfα+ cells among the F4/80+ cells in the indicated liver sections. (I, J) Heatmaps of upregulated DEGs for the indicated annotations of the “p53 signaling” and “cell/death/survival” clusters, respectively. K) Western blots of lysates from 4-month-old livers and liver tumors of 14-month-old mice. Ponceau S (PonS) served as loading control. (L) Quantification of TUNEL-positive cells in liver sections of the indicated 4-month-old mice. Data in H and L represents mean ± s.e.m. Statistics: H and L, two-tailed unpaired t-test. **P < 0.01. Heatmap legends in E, G, I, and J are as in D.
A second cluster identified by functional annotation analyses showed enrichment for immune system-related functions, including the upregulation of multiple factors that regulate Tnf signaling (Figure 7G). Consistent with this, Ccne1T livers showed elevated expression of Tnf (encoding Tnfα; Figure 7G), a cytokine linked to inflammation, necrosis and apoptosis in various liver diseases, including HCC.29–31 Kupffer cells were a source of increased Tnfα production, as evidenced by immunolabeling of liver sections from 4-month-old dox-treated Ccne1T and TA mice for F4/80 and Tnfα (Figure 7H). Kupffer/macrophage cell numbers were not increased, and there was no evidence for an invasion of other immune cell types at 4 months (Supplementary Figure 7D and E).
Other clusters identified by functional annotation analyses showed enrichment for functions related to DNA damage/repair, p53 signaling, and cell death/survival (Figure 1C). All these clusters included several p53-regulated genes, including the cell-cycle regulators Cdkn1a, Cdkn1b, Ccna2 and Ccnb1 (Figure 7I), the pro-apoptotic genes Bbc3 (encoding Puma), Bax and Tnfrsf10 (encoding DR5/Killer) (Figure 7J and Supplementary Figure 8A), and the repair gene Ddb2 (Supplementary Figure 8B). Western blot analysis of lysates of 4-month-old Ccne1T and TA liver samples demonstrated that p53, p21, Bax and Puma protein levels were upregulated with cyclin E1 overexpression (Figure 7K). In contrast, p53 was consistently undetectable in Ccne1T liver tumors (Figure 7K), indicating that inactivation of this tumor suppressor is a requirement for liver tumorigenesis in our model, which also holds true for many human HCCs.32,33 Interestingly, while loss of p53 in Ccne1T liver tumors coincided with reduced p21 expression, levels of Bax and Puma did not decline, implying that their expression was regulated in a p53-independent fashion (Figure 7K). Despite elevated expression of pro-apoptotic genes in 4-month-old Ccne1T livers, cyclin E1 overexpression did not increase apoptosis, as revealed by TUNEL staining (Figure 7L). Several genes associated with pro-survival functions were differentially upregulated in 4-month-old Ccne1T livers, including Birc5, which encodes Survivin (Figure 7J and Supplementary Figure 7G), raising the possibility that prosurvival mechanisms counteract pro-apoptotic functions to retain hepatocyte viability.
Induction of p21, as observed in 4-month-old Ccne1T livers, is a feature of cellular senescence. Another key senescence marker, p16 (Cdkn2a), was however undetectable by RNA sequencing of these livers (data not shown). The same was true for key components of the senescence-associated secretory phenotype (SASP) (Supplementary Figure 8C). Additionally, 4-month-old Ccne1T livers failed to stain for senescence-associated beta-galactosidase (SA-β-Gal), a widely used marker of senescence (Supplementary Figure 8D). Collectively, these data demonstrate that hepatocytes are unlikely to activate the senescence program in response to cyclin E1 overexpression.
Discussion
Our approach of ubiquitously overexpressing cyclin E1 uncovered that this cyclin is particularly oncogenic in hepatocytes, a finding that has several important clinical implications. First, our data indicate that in a subset of HCC patients with chronic HBV infection, neoplastic transformation is likely to be driven by genomic integration of the virus in the CCNE1 locus. Thus, it is not only important to treat chronic HBV infection early to reduce the risk of cirrhosis, but also to limit genomic viral integration in CCNE1 and perhaps other common integration sites encoding oncogenes with putative neoplastic properties in the liver, such as TERT and KMT2B,11, 13, 14 Second, our findings imply that insertion of AAV2 into the CCNE1 locus is a capable initiating event in patients with HCC.17 Unlike HBV patients, HCC cases with AAV2 insertions show no evidence of cirrhotic disease, reminiscent of cyclin E1 overexpressing mice.17 Third, AAV-derived vectors are now widely used as gene delivery tools in clinical-stage experimental therapeutic strategies for various conditions, including lipoprotein lipase deficiency, Leber congenital amaurosis, and the bleeding disorder hemophilia B. Although, these vehicles thus far appear to be safe in both preclinical and clinical settings, the observation that robust CCNE1 expression is sufficient to drive HCC in otherwise wildtype mice warrants consideration of precautionary monitoring of patients receiving AAV-based therapies for indications of liver pathology, particularly when vectors are used that show tropism towards hepatocytes. For instance, frequent non-invasive testing such as alpha fetoprotein might be beneficial.
Our studies provide insight into how and why cyclin E1 overexpression selectively drives tumorigenesis in the liver. Importantly, cyclin E1 overexpression increased aneuploidy in multiple tissues, but two other cancer-associated CIN phenotypes, polyploidization and DSBs, were observed only in hepatocytes. Our data suggest that cyclin E1 overexpression promotes polyploidization through precocious S-phase entry, erroneous DNA replication and aberrant expression of mitotic regulators, resulting in abortion of mitotic progression and cytokinesis. Polyploidization may further be encouraged by compensatory proliferation in response to hepatocyte necrosis induced by Tnfα released by Kupffer cells.28, 29 Near polyploid-aneuploidies may arise when hepatocytes successfully separate their chromosomes but do so inaccurately due to aberrant centrosome dynamics, leading to merotely-prone non-perpendicular spindles that yield lagging chromosomes. Our in-depth studies in MEFs suggest that cyclin E1 overexpression disrupts centrosome dynamics through hyperactivation of cyclin B2, Aurora A, and Plk1, three centro-some-associated core components of a signaling cascade that controls centrosome disjunction.26, 27, 29 In addition to whole chromosome instability, we observed segmental aneuploidies, which are known to be induced by DSBs.34 In MEFs, cyclin E1 overexpression induces replication stress, thus promoting the formation of chromatin bridges that resolve via DSBs.26, 36 Notably, transcriptomic analysis uncovered that cyclin E1 overexpressing hepatocytes experience oxidative stress, a well-documented alternative cause of DSBs.35, 36 In fact, given the rarity of chromatin bridges in anaphases upon partial hepatectomy, oxidative stress may be the primary source of structural chromosome damage in hepatocytes that overexpress cyclin E1. Oxidative stress has been long recognized as a key contributor to the initiation and progression of cancer through multiple mechanisms, including oncogene activation, tumor suppressor gene inactivation, aberrant metabolism, and mitochondrial dysfunction.37 p53 is activated in response to oxidative stress to remove damage to genomic and mitochondrial DNA and to regulate the expression of antioxidant genes38, 39, and its inactivation is associated with tumor progression.32, 33,40 We consistently observed this exact pattern of activation of p53 at the preneoplastic stage and the subsequent inactivation of p53 as tumors emerge, giving credence to the idea that oxidative stress caused by cyclin E1 overexpression drives liver tumorigenesis.
In closing, our demonstration here that cyclin E1 overexpression causes liver-specific molecular and cellular defects underscores that it will be important to use comprehensive experimental approaches to assess whether and how overexpression of other genes at common integration sites of liver tropic viruses drives hepatocarcinogenesis. Such efforts hold promise for the identification of druggable molecular targets for the development of innovative experimental therapies for the treatment of HCC.
Supplementary Material
Acknowledgements:
We thank Darren Baker and members of the van Deursen lab for helpful discussions, feedback, or help with methods. We thank Wei Zhou and Ming Li of Mayo Clinic’s Gene Knockout Mouse Core Facility for ES cell microinjection and chimera breeding, Dr. Arun Kanakkanthara for performing DNA fiber assays, the Cytogenetics Core for FISH, and the Sequencing Core of the Medical Genomics Facility for RNA-sequencing. This work was supported by a grant from the NIH: R01 CA096985 and CA168709 to JMVD.
Footnotes
Publisher's Disclaimer: This is a PDF file of an unedited manuscript that has been accepted for publication. As a service to our customers we are providing this early version of the manuscript. The manuscript will undergo copyediting, typesetting, and review of the resulting proof before it is published in its final citable form. Please note that during the production process errors may be discovered which could affect the content, and all legal disclaimers that apply to the journal pertain.
Competing interests: The authors declare no conflicts of interest.
References
- 1.Ohtsubo M, Roberts J. Cyclin-dependent regulation of G1 in mammalian fibroblasts. Science 1993;259:1908–1912. [DOI] [PubMed] [Google Scholar]
- 2.Resnitzky D, Gossen M, Bujard H, et al. Acceleration of the G1/S phase transition by expression of cyclins D1 and E with an inducible system. Mol Cell Biol 1994;14:1669–79. [DOI] [PMC free article] [PubMed] [Google Scholar]
- 3.Geng Y, Yu Q, Sicinska E, et al. Cyclin E ablation in the mouse. Cell 2003;114:431–43. [DOI] [PubMed] [Google Scholar]
- 4.Parisi T, Beck AR, Rougier N, et al. Cyclins E1 and E2 are required for endoreplication in placental trophoblast giant cells. EMBO J 2003;22:4794–803. [DOI] [PMC free article] [PubMed] [Google Scholar]
- 5.Geng Y, Michowski W, Chick JM, et al. Kinase-independent function of E-type cyclins in liver cancer. Proc Natl Acad Sci U S A 2018; 115:1015–1020. [DOI] [PMC free article] [PubMed] [Google Scholar]
- 6.Geng Y, Lee Y-M, Welcker M, et al. Kinase-Independent Function of Cyclin E. Molecular Cell 2007;25:127–139. [DOI] [PubMed] [Google Scholar]
- 7.Ohashi R, Gao C, Miyazaki M, et al. Enhanced expression of cyclin E and cyclin A in human hepatocellular carcinomas. Anticancer Res 2001;21:657–62. [PubMed] [Google Scholar]
- 8.Bartkova J, Rezaei N, Liontos M, et al. Oncogene-induced senescence is part of the tumorigenesis barrier imposed by DNA damage checkpoints. Nature 2006;444:633–7. [DOI] [PubMed] [Google Scholar]
- 9.Spruck CH, Won KA, Reed SI. Deregulated cyclin E induces chromosome instability. Nature 1999;401:297–300. [DOI] [PubMed] [Google Scholar]
- 10.Beroukhim R, Mermel CH, Porter D, et al. The landscape of somatic copy-number alteration across human cancers. Nature 2010;463:899. [DOI] [PMC free article] [PubMed] [Google Scholar]
- 11.Schulze K, Imbeaud S, Letouze E, et al. Exome sequencing of hepatocellular carcinomas identifies new mutational signatures and potential therapeutic targets. Nat Genet 2015;47:505–511. [DOI] [PMC free article] [PubMed] [Google Scholar]
- 12.Comprehensive and Integrative Genomic Characterization of Hepatocellular Carcinoma. Cell 2017;169:1327–1341.e23. [DOI] [PMC free article] [PubMed] [Google Scholar]
- 13.Sung WK, Zheng H, Li S, et al. Genome-wide survey of recurrent HBV integration in hepatocellular carcinoma. Nat Genet 2012;44:765–9. [DOI] [PubMed] [Google Scholar]
- 14.Zhao LH, Liu X, Yan HX, et al. Genomic and oncogenic preference of HBV integration in hepatocellular carcinoma. NatCommun 2016;7:12992. [DOI] [PMC free article] [PubMed] [Google Scholar]
- 15.Purcell RH. THE DISCOVERY OF THE HEPATITIS VIRUSES. Gastroenterology 1993;104:955–963. [DOI] [PubMed] [Google Scholar]
- 16.Calcedo R, Vandenberghe LH, Gao G, et al. Worldwide epidemiology of neutralizing antibodies to adeno-associated viruses. J Infect Dis 2009;199:381–90. [DOI] [PMC free article] [PubMed] [Google Scholar]
- 17.Nault JC, Datta S, Imbeaud S, et al. Recurrent AAV2-related insertional mutagenesis in human hepatocellular carcinomas. Nat Genet 2015;47:1187–93. [DOI] [PubMed] [Google Scholar]
- 18.Hochedlinger K, Yamada Y, Beard C, et al. Ectopic expression of Oct-4 blocks progenitor-cell differentiation and causes dysplasia in epithelial tissues. Cell 2005;121:465–77. [DOI] [PubMed] [Google Scholar]
- 19.Liu Q, Guntuku S, Cui XS, et al. Chk1 is an essential kinase that is regulated by Atr and required for the G(2)/M DNA damage checkpoint. Genes Dev 2000;14:1448–59. [PMC free article] [PubMed] [Google Scholar]
- 20.Ganem NJ, Godinho SA, Pellman D. A mechanism linking extra centrosomes to chromosomal instability. Nature 2009;460:278–82. [DOI] [PMC free article] [PubMed] [Google Scholar]
- 21.van Ree JH, Nam HJ, van Deursen JM. Mitotic kinase cascades orchestrating timely disjunction and movement of centrosomes maintain chromosomal stability and prevent cancer. Chromosome Res 2016;24:67–76. [DOI] [PMC free article] [PubMed] [Google Scholar]
- 22.Gregan J, Polakova S, Zhang L, et al. Merotelic kinetochore attachment: causes and effects. Trends in Cell Biology 2011;21:374–381. [DOI] [PMC free article] [PubMed] [Google Scholar]
- 23.Nam HJ, van Deursen JM. Cyclin B2 and p53 control proper timing of centrosome separation. Nat Cell Biol 2014;16:538–49. [DOI] [PMC free article] [PubMed] [Google Scholar]
- 24.Ren B, Cam H, Takahashi Y, et al. E2F integrates cell cycle progression with DNA repair, replication, and G(2)/M checkpoints. Genes Dev 2002;16:245–56. [DOI] [PMC free article] [PubMed] [Google Scholar]
- 25.Iwasa J, Shimizu M, Shiraki M, et al. Dietary supplementation with branched-chain amino acids suppresses diethylnitrosamine-induced liver tumorigenesis in obese and diabetic C57BL/KsJ-db/db mice. Cancer Science 2010;101:460–467. [DOI] [PMC free article] [PubMed] [Google Scholar]
- 26.Wang MJ, Chen F, Lau JTY, et al. Hepatocyte polyploidization and its association with pathophysiological processes. Cell Death Dis 2017;8:e2805. [DOI] [PMC free article] [PubMed] [Google Scholar]
- 27.Satapati S, Kucejova B, Duarte JA, et al. Mitochondrial metabolism mediates oxidative stress and inflammation in fatty liver. J Clin Invest 2016;126:1605. [DOI] [PMC free article] [PubMed] [Google Scholar]
- 28.Sakurai T, He G, Matsuzawa A, et al. Hepatocyte necrosis induced by oxidative stress and IL-1 alpha release mediate carcinogen-induced compensatory proliferation and liver tumorigenesis. Cancer Cell 2008;14:156–65. [DOI] [PMC free article] [PubMed] [Google Scholar]
- 29.Maeda S, Kamata H, Luo JL, et al. IKKbeta couples hepatocyte death to cytokine-driven compensatory proliferation that promotes chemical hepatocarcinogenesis. Cell 2005;121:977–90. [DOI] [PubMed] [Google Scholar]
- 30.Pikarsky E, Porat RM, Stein I, et al. NF-kappaB functions as a tumour promoter in inflammation-associated cancer. Nature 2004;431:461–6. [DOI] [PubMed] [Google Scholar]
- 31.Kamata H, Honda S, Maeda S, et al. Reactive oxygen species promote TNFalpha-induced death and sustained JNK activation by inhibiting MAP kinase phosphatases. Cell 2005;120:649–61. [DOI] [PubMed] [Google Scholar]
- 32.Ozturk M p53 mutation in hepatocellular carcinoma after aflatoxin exposure. Lancet 1991;338:1356–9. [DOI] [PubMed] [Google Scholar]
- 33.McClendon AK, Dean JL, Ertel A, et al. RB and p53 cooperate to prevent liver tumorigenesis in response to tissue damage. Gastroenterology 2011; 141:1439–50. [DOI] [PMC free article] [PubMed] [Google Scholar]
- 34.Richardson C, Jasin M. Frequent chromosomal translocations induced by DNA double-strand breaks. Nature 2000;405:697–700. [DOI] [PubMed] [Google Scholar]
- 35.Sharma V, Collins LB, Chen TH, et al. Oxidative stress at low levels can induce clustered DNA lesions leading to NHEJ mediated mutations. Oncotarget 2016;7:25377–90. [DOI] [PMC free article] [PubMed] [Google Scholar]
- 36.Svilar D, Goellner EM, Almeida KH, et al. Base excision repair and lesion-dependent subpathways for repair of oxidative DNA damage. Antioxid Redox Signal 2011;14:2491–507. [DOI] [PMC free article] [PubMed] [Google Scholar]
- 37.Kalyanaraman B, Cheng G, Hardy M, et al. Teaching the basics of reactive oxygen species and their relevance to cancer biology: Mitochondrial reactive oxygen species detection, redox signaling, and targeted therapies. Redox Biol 2018;15:347–362. [DOI] [PMC free article] [PubMed] [Google Scholar]
- 38.Sablina AA, Budanov AV, Ilyinskaya GV, et al. The antioxidant function of the p53 tumor suppressor. Nat Med 2005; 11:1306–13. [DOI] [PMC free article] [PubMed] [Google Scholar]
- 39.Zhuang J, Wang PY, Huang X, et al. Mitochondrial disulfide relay mediates translocation of p53 and partitions its subcellular activity. Proc Natl Acad Sci U S A 2013;110:17356–61. [DOI] [PMC free article] [PubMed] [Google Scholar]
- 40.Solimini NL, Xu Q, Mermel CH, et al. Recurrent hemizygous deletions in cancers may optimize proliferative potential. Science 2012;337:104–9. [DOI] [PMC free article] [PubMed] [Google Scholar]
- 41.Kahraman A, Barreyro FJ, Bronk SF, et al. TRAIL mediates liver injury by the innate immune system in the bile duct-ligated mouse. Hepatology 2008;47:1317–30. [DOI] [PMC free article] [PubMed] [Google Scholar]
- 42.Mitchell C, Willenbring H. A reproducible and well-tolerated method for 2/3 partial hepatectomy in mice. Nat Protoc 2008;3:1167–70. [DOI] [PubMed] [Google Scholar]
- 43.van den Bos H, Bakker B, Taudt A, et al. Quantification of Aneuploidy in Mammalian Systems. Methods Mol Biol 2019;1896:159–190. [DOI] [PubMed] [Google Scholar]
- 44. Ricke RM Jeganathan KB, Malureanu L, et al. Bub1 kinase activity drives error correction and mitotic checkpoint control but not tumor suppression. The Journal of Cell Biology 2012;199:931–949. [DOI] [PMC free article] [PubMed] [Google Scholar]
Associated Data
This section collects any data citations, data availability statements, or supplementary materials included in this article.


